QYLD: Consider JEPQ As An Alternative
Summary
- QYLD ETF writes ATM call options on the Nasdaq 100 Index to generate high distribution yields.
- The Fund has underperformed because it trades off all of the index's upside.
- Instead of QYLD, investors may want to consider the JEPQ, which also writes call options on the Nasdaq 100 Index, but sells OTM calls and retains some upside.

PM Images
Last summer, I wrote a cautious follow-up article on the Global X NASDAQ 100 Covered Call ETF (NASDAQ:QYLD). In my opinion, on any reasonably long time frame, QYLD's strategy will likely underperform the passive Invesco QQQ ETF (QQQ) in delivering total returns, since markets trend up and the QYLD ETF trades off upside returns for premium income.
So far, my cautious stance has proven correct, as the QYLD ETF has only delivered 11% total returns since my article, compared to 19% for the QQQ ETF and 18% or the S&P 500 (Figure 1).

Figure 1 - QYLD has underperformed (Seeking Alpha)
In fact, the QYLD underperforming is the norm instead of the exception. If we look at the long-term total return of the QYLD ETF, we can see that it has a 3/5/10 yr average annual return of only 3.6%/6.6%/7.5% to April 30, 2024 (Figure 2).

Figure 2 - QYLD historical returns (Morningstar)
This is far lower than that of the QQQ ETF with 3/5/10 yr average annual return of 8.6%/18.3%/18.1% over the same timeframes (Figure 3).

Figure 3 - QQQ historical returns (Morningstar)
Understanding QYLD's Underperformance
To understand why QYLD underperforms, we need to understand the fund's strategy. The QYLD ETF owns the stocks in the Nasdaq 100 Index and seeks to pay an attractive distribution to unitholders by selling at-the-money ("ATM") call options on the Nasdaq 100 Index to collect premium income.
Moneyness in this case refers to the strike price of options sold relative to the market price, and determines how much premiums are received vs. upside potential traded away (Figure 4).

Figure 4 - QYLD strategy (Global X ETFs)
The QYLD ETF writes one-month ATM call options that are rolled every month on 100% of the notional value of the fund. Mathematically, if we think of the forward returns as a probability distribution, then by giving up half of the returns distribution (selling ATM calls), the QYLD is bound to underperform.
High Yield But Amortizing NAV
While the premiums the QYLD generates can also fluctuate based on the implied volatility of the Nasdaq 100 Index at any given time, in general, selling ATM calls can net the QYLD ETF 1.5-4.0% per month in premiums.
However, not all the premiums collected are paid out to investors. Instead, the QYLD ETF pays the lesser of 1% or half of the premiums collected in any given month, with the rest re-invested into the fund. Why does the QYLD have to re-invest premiums?
The QYLD needs to re-invest excess premiums into the fund to cover situations where the written call options expire 'in-the-money'.
For example, consider a month where the QYLD ETF wrote calls on the Nasdaq 100 Index with 17,000 strike in exchange for $300 (1.76% notional) in premiums. If the Nasdaq 100 Index is at 17,300 when the option expires, then the QYLD must pay out $300 to settle the difference. In this example, the QYLD would have paid $150 in distributions (half of the premiums received) and $300 to settle the options, so the net asset value ("NAV") of the fund decreased by $150 at the end of the month.
Over time, we see QYLD's strategy paying out more in distributions and option settlements than it earns in premiums, which leads to a modestly amortizing NAV (Figure 5).

Figure 5 - QYLD is an amortizing fund (Global X ETFs)
Another way to think about QYLD's amortizing NAV is to see that the total returns of the fund are only ~6-7%, and yet the fund pays an 11-12% distribution yield, so the difference must be funded through amortization of the NAV by 4-5% per year.
QYLD vs. JEPQ
Instead of the QYLD, what are some alternatives investors can consider if they want a relatively conservative, high-yielding equity options fund? I think investors can consider the JPMorgan Nasdaq Equity Premium Income ETF (JEPQ) instead (Figure 6).

Figure 6 - QYLD vs. JEPQ, fund details (Seeking Alpha)
JEPQ is also an options-income fund that writes call options on the Nasdaq 100 Index, but it writes out-of-the-money ("OTM") options, so the fund retains some of the index's upside. It has a lower distribution yield compared to QYLD, but not by much (Figure 7).

Figure 7 - QYLD vs. JEPQ, distribution yield (Seeking Alpha)
When the underlying index is in a strong bull market like we have seen in recent years, missing the upside can have a large negative impact on total returns. For example, on a trailing 1-year basis, JEPQ has returned 24.7% compared to just 13.0% for QYLD (Figure 8). QQQ and SPY returns were 31.7% and 22.2% for reference.
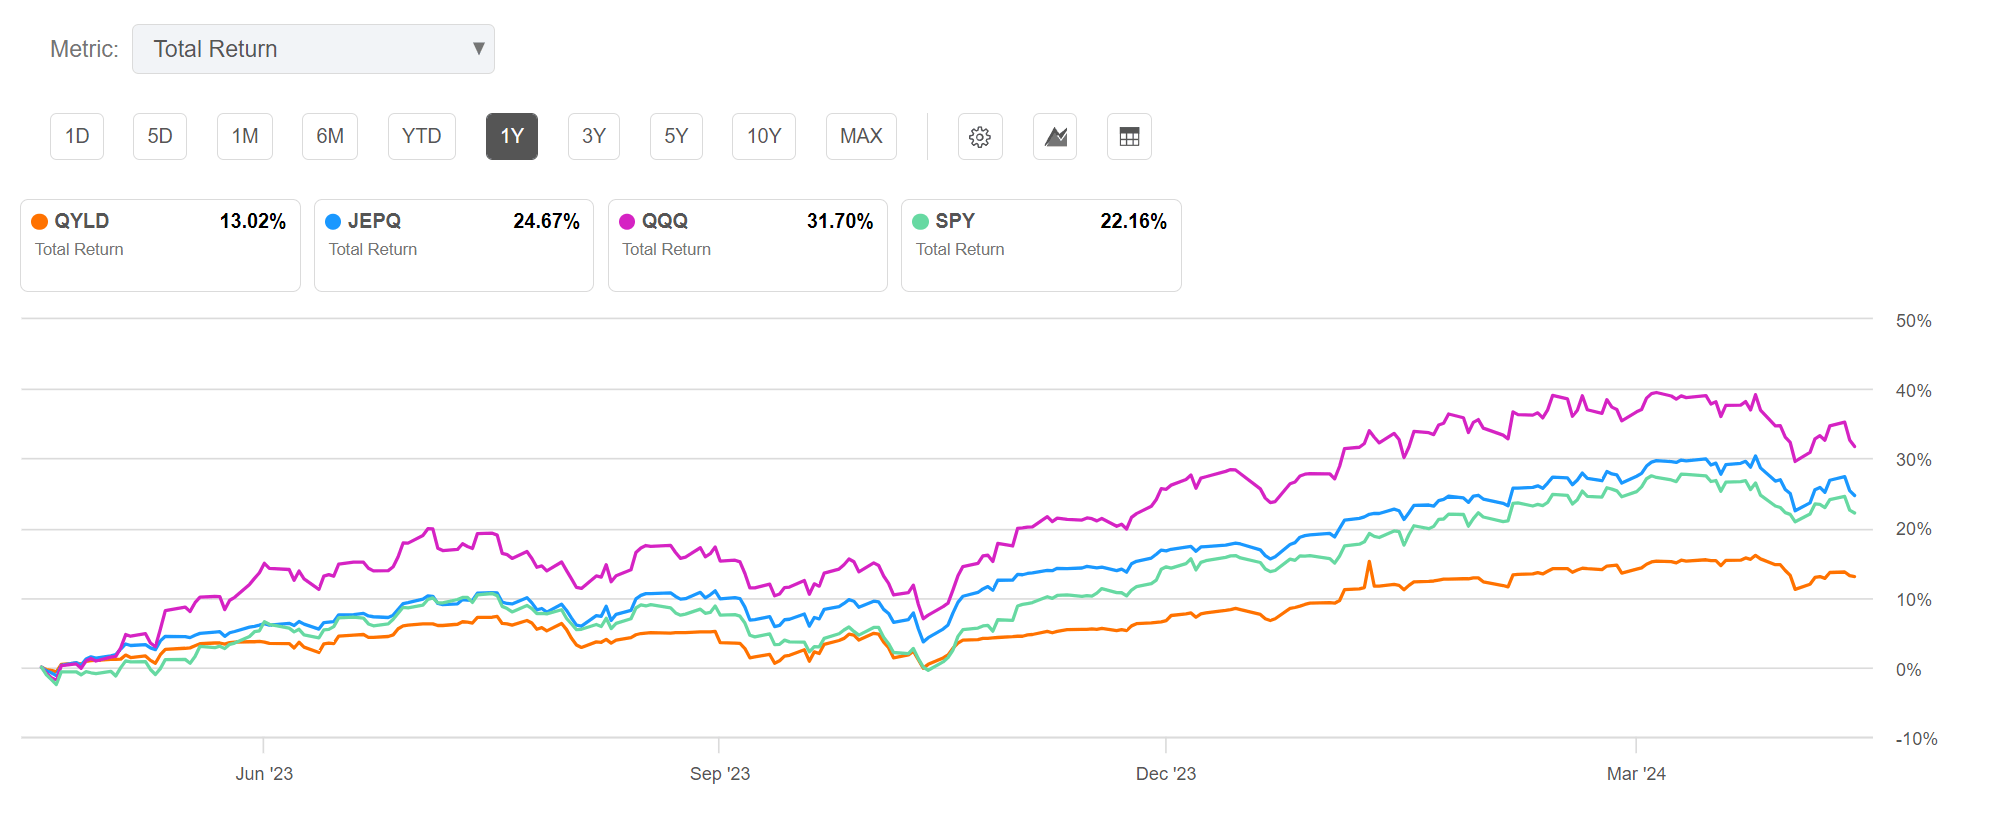
Figure 8 - QYLD vs. JEPQ, 1 year trailing returns (Seeking Alpha)
Since JEPQ's inception in May 2022, JEPQ has returned 25.7% vs. 9.4% for QYLD, 29.7% for QQQ, and 20.3% for SPY (Figure 9).

Figure 9 - QYLD vs. JEPQ, since May 2022 returns (Seeking Alpha)
I last wrote about the JEPQ fund here.
Watch Out For Tax Implication Of Distributions
Another aspect of the QYLD ETF that is little talked about is the tax implication of its high distribution yield. Due to its investments in both equities and option contracts, the QYLD ETF uses a 'mixed straddle' approach for taxation purposes.
Option contracts are treated as a §1256 contract and stocks are treated as a non-§1256 security. These two categories have differing taxation characteristics on a day-to-day basis. Non-§1256 security gains are considered short-term, while §1256 contracts are a blend of 60% long-term and 40% short-term. At the end of the year, QYLD adds up the daily running total of short-term and long-term capital gains to determine the characteristics of the total distributions made to shareholders.
Return of capital ("ROC") arises when the fund's distribution policy differs from the mixed straddle calculation described above. For example, for QYLD, the fund expects to distribute half of the premiums received by writing calls on the Nasdaq 100, capped at 1% of the fund's NAV. This distribution policy is designed to provide recurring income to investors, but is different from the mixed straddle calculation above. Therefore, in some years, the mixed straddle approach may find the fund has distributed more than is necessary, with the excess categorized as ROC.
For example, in 2023, the QYLD ETF paid $2.04/share in distribution with $1.71 considered return of capital ("ROC") and $0.33 characterized as ordinary dividends (Figure 10).

Figure 10 - QYLD 2023 distribution taxation (Global X ETFs)
However, in 2019, QYLD paid $2.32 per share in distributions with $1.98 considered as ordinary dividends/short term capital gains, $0.06 was treated as long-term capital gains, and only $0.28 was ROC.
Thus, an investor's tax obligation with the QYLD ETF will vary depending on market action and is generally unknown until the Form 1099 is issued at year-end.
Conclusion
Since my last update, the Global X Nasdaq 100 Covered Call ETF has underperformed the QQQ ETF. This is to be expected because the QYLD trades off upside returns for premium income. While QYLD's ~12% distribution yield may look attractive, actual total returns are lower at 6-7% per annum.
Instead of the QYLD, I think a superior option income fund that is also based on the Nasdaq 100 Index is the JPMorgan Nasdaq Premium Income ETF (JEPQ). The JEPQ has slightly lower distribution yields, as it sells OTM instead of ATM calls. However, by retaining some of the returns upside, the JEPQ outperforms QYLD over the long-run.
Disclaimer: Investing carries risk. This is not financial advice. The above content should not be regarded as an offer, recommendation, or solicitation on acquiring or disposing of any financial products, any associated discussions, comments, or posts by author or other users should not be considered as such either. It is solely for general information purpose only, which does not consider your own investment objectives, financial situations or needs. TTM assumes no responsibility or warranty for the accuracy and completeness of the information, investors should do their own research and may seek professional advice before investing.
- KSR·05-06👍LikeReport
- Tom Chow·05-05goodLikeReport