ZINGER KEY POINTS
Apple Wanderlust Event fails to impress investors as Apple stock takes a bearish turn.
Explore why Apple's shares are now on a downward trajectory post-event.
In the wake of Apple Inc.’s much-hyped Apple’s Wonderlust Event 2023, Wall Street was bracing for a spectacular surge in the tech giant’s stock.
Reality proved to be quite the opposite.
What was supposed to be a fireworks display of innovation turned into a damp squib, and AAPL shares are feeling the heat.
Benzinga will unravel how Apple’s stock reacted to the event, and what the key levels are to watch ahead for the stock price.
How Did AAPL React To Apple Event 2023?
The response from investors was underwhelming, as Apple’s shares experienced a 1.71% decline to $176.30 Tuesday.
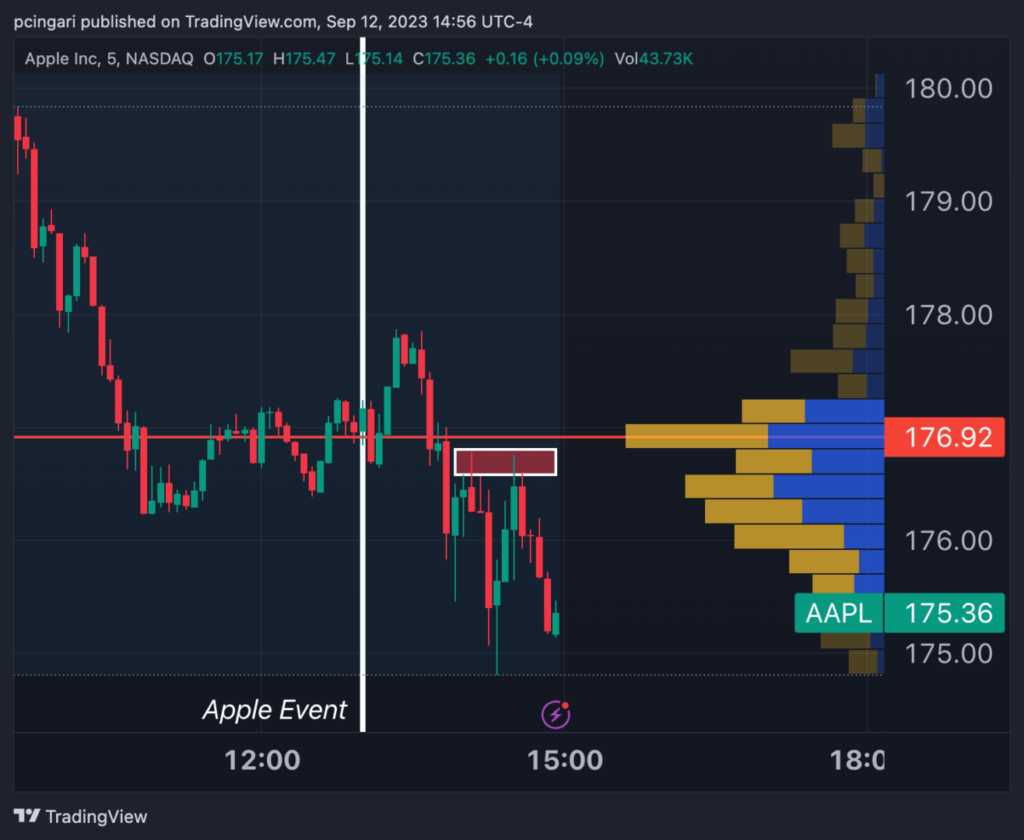
Intriguingly, when examining the 5-minute intraday chart, it becomes evident the stock’s decline intensified during the Apple Wonderlust Event. This suggests that the market didn’t initially warm up to Apple’s new product offerings.
The share price found support at $174.8, the day’s low, which coincided with the moment Apple revealed the pricing for the new iPhone 15 Pro.
Despite a brief rebound to $176.75, the shares once again encountered selling pressure, ultimately pulling back to the daily lows as of the time of writing.
An intraday volume analysis identified $176.92 as the level with the highest daily trading volume on AAPL shares.
Interestingly, this level corresponds to the price at which Apple’s shares were trading at the start of the Apple Wonderlust Event, indicating it could serve as a significant resistance mark moving forward.
Chart: AAPL 5-Min Price Action On Tuesday
Why Apple Could Test Support At $170
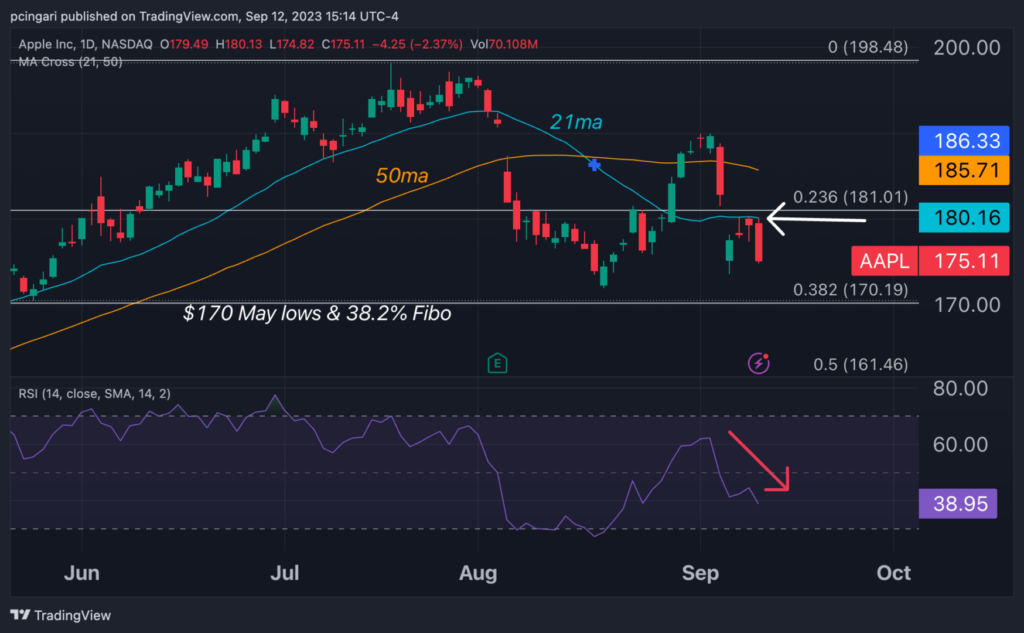
Shifting from the intraday chart to the daily chart, we observe that Apple’s stock prices have struggled to breach the 21-day moving average resistance, situated around $180. This resistance level has proven a big hurdle, as it was tested but never broken over the last three market sessions.
As a result, the short-term trend remains bearish, with the 21-day moving average trading below the 50-day moving average. The RSI (Relative Strength Index) is also signaling a worrying move downward.
Looking to the downside, the $170 support holds significant importance as it served as a solid floor for Apple’s stock back in May. Furthermore, it aligns with the 38.2% Fibonacci retracement level between the 2023 price highs and lows.
September has so far proven to be a challenging month for Apple, with prices experiencing a 6% decline. This decline extends the losses observed after a 4.4% negative close in August.


Comments