Market Overview
All three major U.S. indexes ended the week(July 28) with gains, after a slew of Big Tech earnings, economic data and central bank announcements boosted investor confidence in a soft landing for the U.S. economy.
Regarding the options market, a total volume of 39,075,969 contracts was traded, down 22% from the previous trading day.
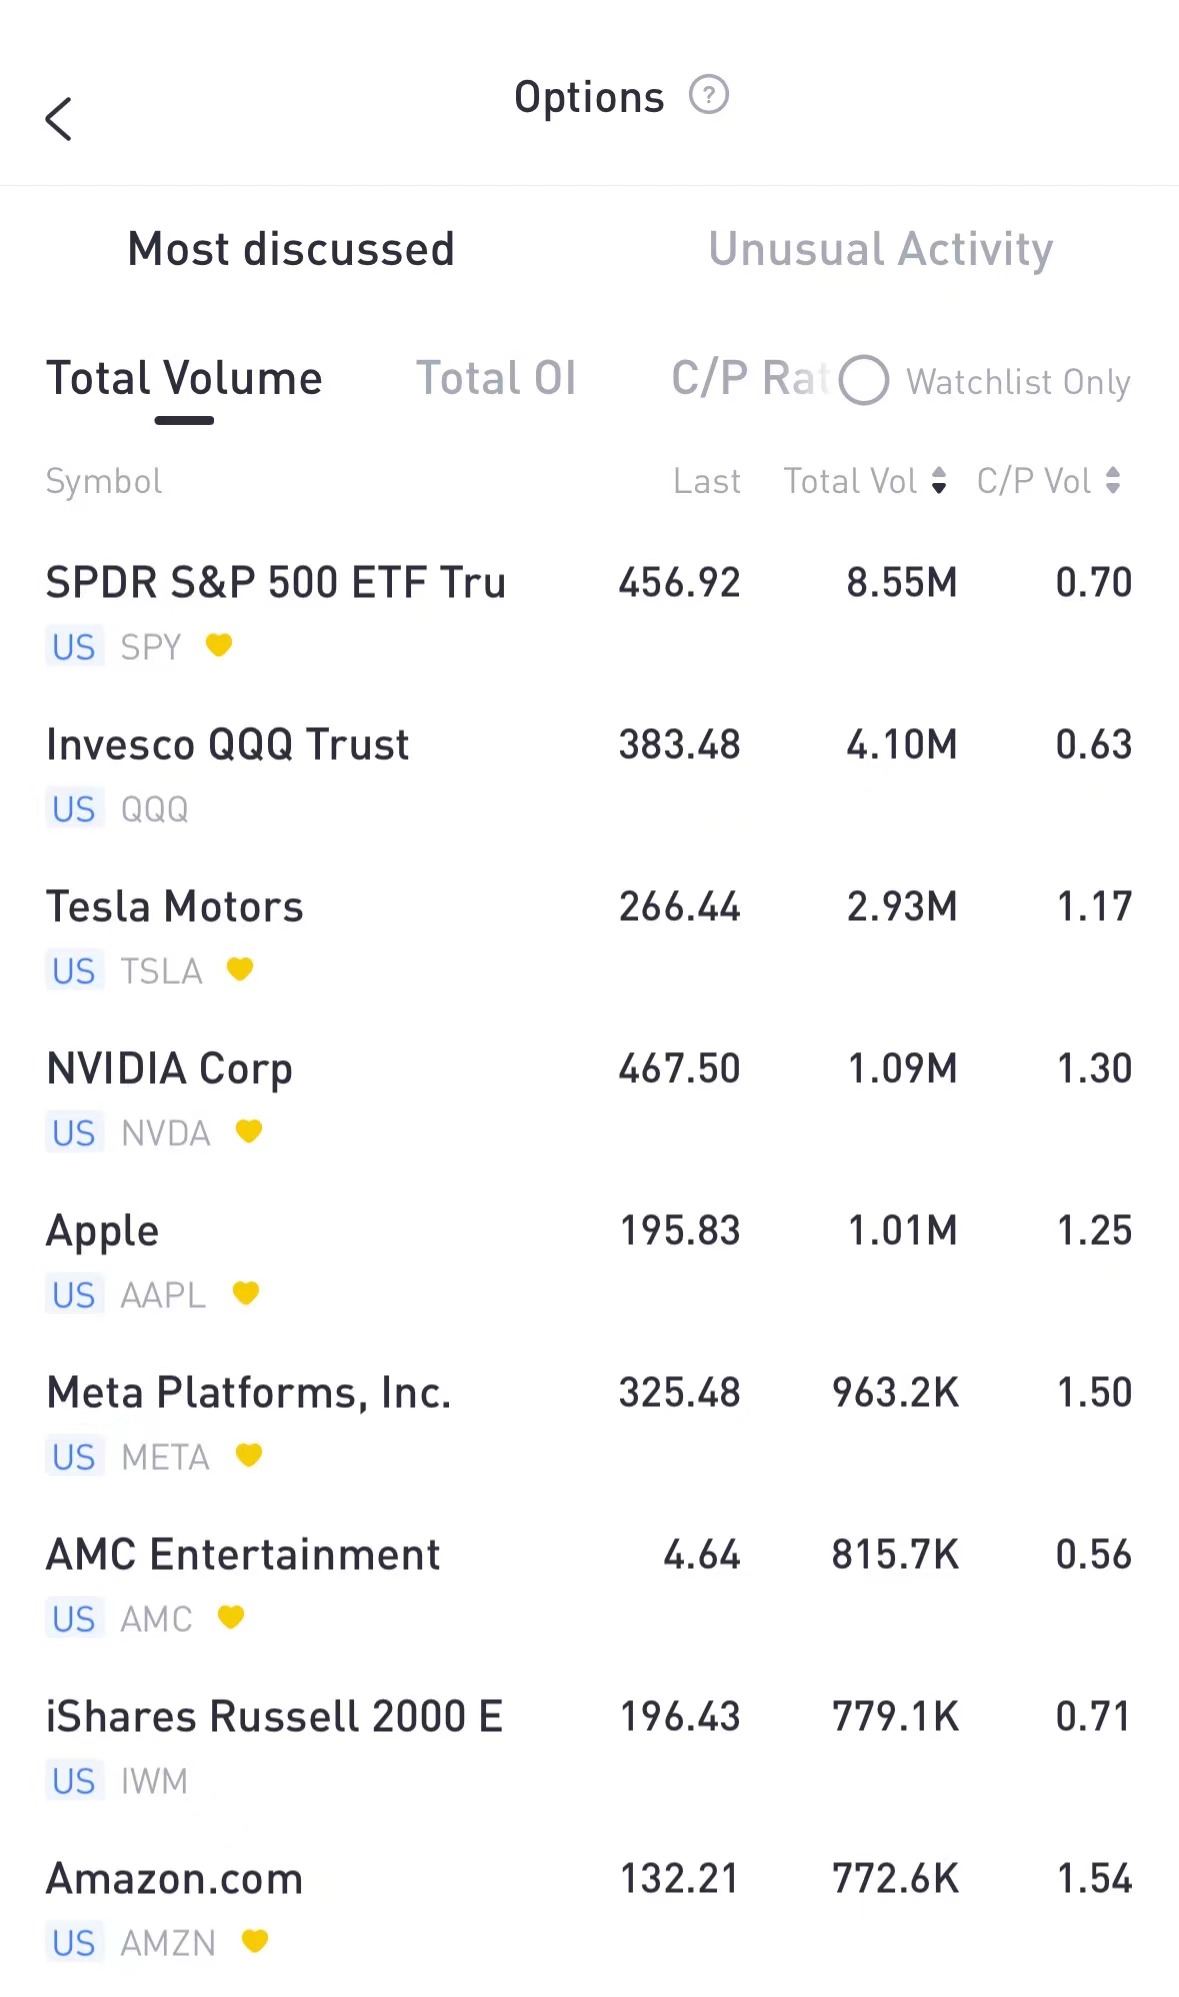
Top 10 Option Volumes
Top 10: SPY; QQQ; TSLA; NVDA; AAPL; META; AMC Entertainment ; IWM; AMZN

Shares of AMC Entertainment Holdings Inc have been hit by a wave of bearish options bets amid uncertainty over the company's stock conversion plan. The one-month moving average of open puts versus call options on AMC hit 1.77-to-1 on Friday, the most bearish the measure has been in at least four years, data showed.
There are 815.7K AMC option contracts traded on Friday. Put options account for 64% of overall option trades. Particularly high volume was seen for the $3 strike put option expiring Sep 15, with 89,480 contracts trading. $AMC 20230915 3.0 PUT$
Most Active Equity Options
Special %Calls >70%: Alibaba ; Palantir Technologies Inc. ; NIO Inc.

Unusual Options Activity

Roku stock surged 31% on Friday after releasing strong earnings. It expects $815 million in net revenue in the July-September period, net revenue grew 11 percent to $847.2 million, while adjusted loss came in at 76 cents per share. The company said it added 1.9 million "active accounts" from the previous quarter to 73.5 million.
There are 649,750 Roku option contracts traded on Friday. Call options account for 57% of overall option trades. Particularly high volume was seen for the $85 strike call option expiring Aug 4, with 16,283 contracts trading. $ROKU 20230804 85.0 CALL$
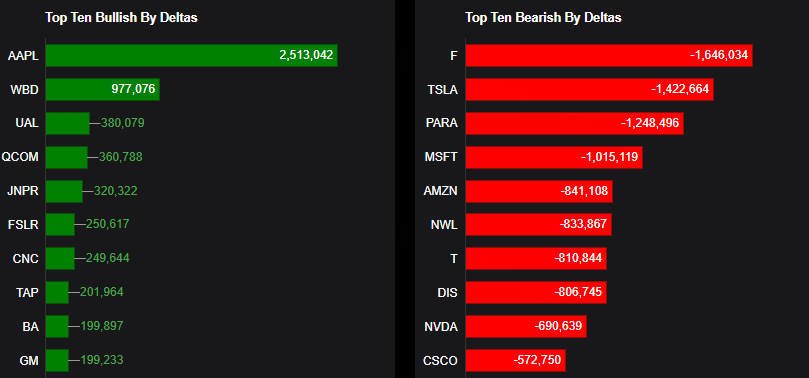
TOP 10 Bullish & Bearish S&P 500
This report shows stocks with the highest volume of bullish and bearish activity by option delta volume, which converts option volume to an equivalent stock volume (bought or sold).
If we take the total positive option delta volume and subtract the total negative option delta volume, we will get the net imbalance. If the net imbalance is positive, there is more bullish pressure. If the net is negative, there is more bearish pressure.
Based on option delta volume, traders bought a net equivalent of 2,513,042 shares of Apple stock. The largest bullish delta came from buying calls.
Top 10 bullish stocks: AAPL, WBD, UAL, QCOM, JNPR, FSLR, CNC, TAP, BA, GM
Top 10 bearish stocks: F, TSLA, PARA, MSFT,AMZN, NWL, T, DIS, NVDA, CSCO

If you are interested in options and you want to:
Share experiences and ideas on options trading.
Read options-related market updates/insights.
Learn more about options trading if you are a beginner in this field.
Please click to join Tiger Options Club
Comments