
A useful exercise will be to compare two similar REITs to determine which qualifies as a better buy.
Last month, wecompared two REITsunder the Mapletree umbrella –Mapletree Logistics Trust(SGX: M44U) andMapletree Pan Asia Commercial Trust(SGX: N2IU).
This time, we decided to dig deeper into CapitaLand Integrated Commercial Trust(SGX: C38U), or CICT, and CapitaLand Ascendas REIT(SGX: A17U), or CLAR.
Both REITs have property giant CapitaLand Investment Limited(SGX: 9CI) as a sponsor.
There is a major difference, though.
CICT is a retail cum commercial REIT while CLAR is Singapore’s largest industrial REIT.
Let’s take a look at a variety of attributes to decide which REIT is the better buy.
Portfolio composition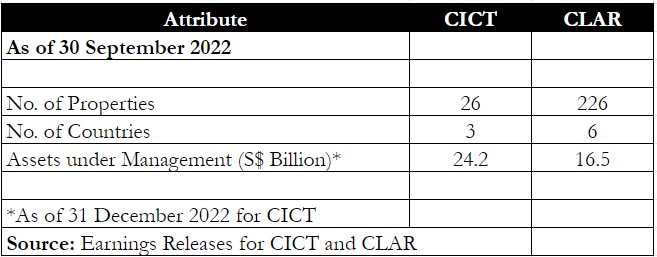
First, we look at each REIT’s portfolio composition.
CLAR is the winner here with a total of 226 properties spread out across a total of six countries.
The industrial REIT is much more diversified but also has a smaller asset under management (AUM) base compared with CICT.
This diversification will stand the REIT in good stead when economic headwinds hit.
Winner: CLAR
Financials and DPU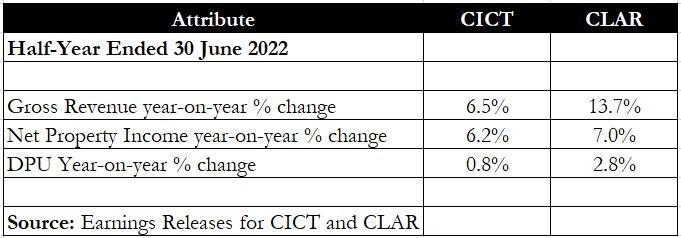
Moving on to financials, we used the fiscal 2022’s first half (1H2022) to compare the two REITs as CLAR did not disclose its financial numbers for the third quarter and first nine months of this year.
CLAR saw a double-digit year on year jump in gross revenue while CICT only recorded a 6.5% year on year increase.
For net property income, CLAR’s year-on-year rise was also slightly better than CICT’s.
Income-seeking investors will also be eyeing the most important attribute of the three – the increase in distribution per unit (DPU).
CLAR posted a slightly better year on year increase of 2.8% for its DPU, compared to CICT, where DPU inched up just 0.8% year on year.
Winner: CLAR
Debt metrics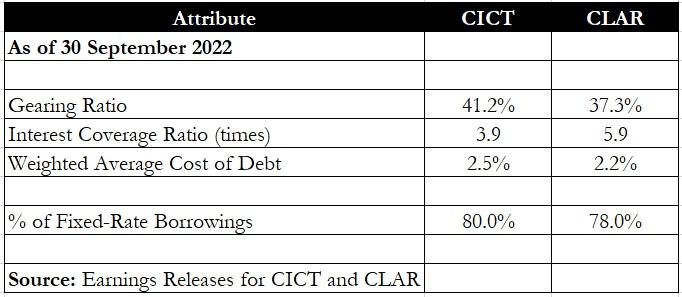
A REIT’s debt metrics determine if it has room to tap on borrowings for acquisitions and whether it can be resilient to rapidinterest rate rises.
The table above shows that CLAR has a lower aggregate leverage ratio of 37.3% versus CICT’s 41.2%, allowing it slightly more room to borrow.
CLAR also enjoys a lower cost of debt and has a higher interest coverage ratio compared with CICT.
But when it comes to fixed-rate borrowings, CICT has a slightly larger proportion (80%) compared with CLAR’s 78%.
Still, we feel that both REITs have more than three-quarters of their loans on fixed rates, which is an admirable proportion.
Hence, CLAR is the winner for this round as it has favourable debt metrics in all three aspects.
Winner: CLAR
Operating metrics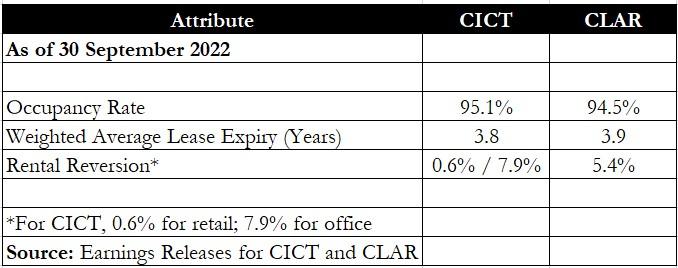
Both CICT and CLAR have strong operating metrics, with each REIT boasting a high occupancy rate hovering around 95%.
CLAR, however, posted a better rental reversion rate of 5.4%.
CICT’s retail rental reversion came in at just 0.6% but its office division posted a near-8% increase in average rental rates.
If we average the two divisions’ rental reversion for CICT, we get around 4.2%, which is still lower than CLAR’s 5.4% reversion rate.
Winner: CLAR
Tenant diversification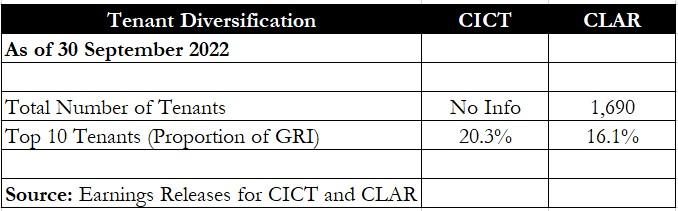
Tenant diversification is an additional attribute to look at for each REIT as this number was disclosed.
CICT did not specify how many tenants it had in total, but CLAR’s 1,690 tenants show how well-diversified the industrial REIT’s tenant base is.
In the event of arecession, CLAR should not get hit too badly as it has a wide spread of tenants that it can rely on.
Another positive trait is that CLAR’s top 10 tenants make up just 16% of the REIT’s gross rental income (GRI).
In contrast, CICT’s top 10 tenants took up one-fifth of its GRI.
Winner: CLAR
Distribution yield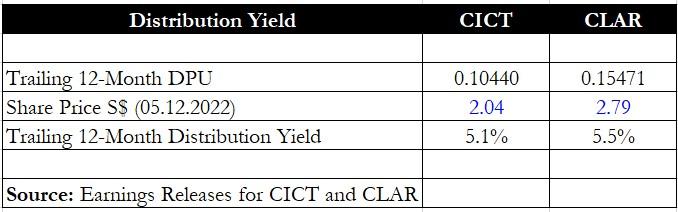
Finally, we took a glance at each REIT’s trailing distribution yield.
CLAR once again wins over CICT with a slightly higher distribution yield of 5.5% against CICT’s 5.1%.
Winner: CLAR
Get Smart: AEIs and ongoing projects
CLAR wins hands down on almost every single metric we have looked at.
However, investors should note that with its large base of properties, small acquisitions made by the REIT will hardly move the DPU needle.
That said, CLAR has a total of S$622.4 million of ongoing projects that promise to boost DPU through organic growth.
This number includes asset enhancement initiatives (AEI), redevelopments, and a convert-to-suit property in the US.
CICT is not sitting still, either.
The retail cum commercial REIT is carrying out AEI at Clarke Quay to enhance the asset, and works will be completed by 3Q2023.
Comments