Boeing Co. shares were trading higher Thursday and bouncing back after being able to hold above a key support level.
The stock could be ready to start an upward trend if it can continue to form higher lows and hold above the support level. The stock was trending on social media sites throughout the day.
Boeing was up 1.34% at $218.75 at the close.
Boeing Daily Chart Analysis
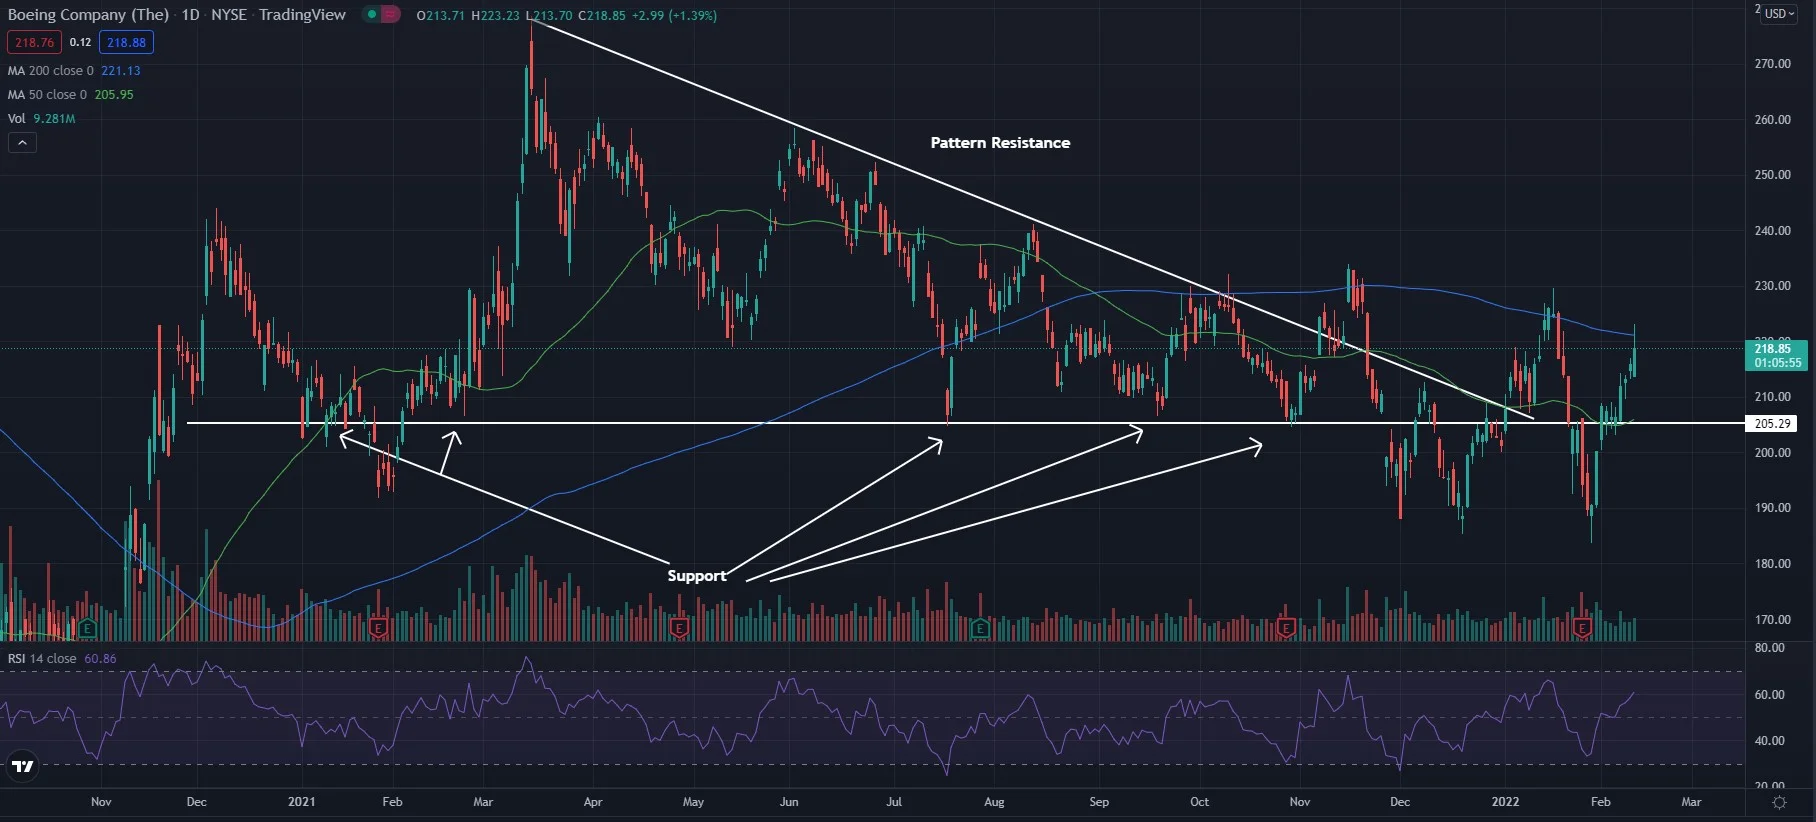
- Shares are bouncing back after holding above the $205 level in what traders call a descending triangle pattern. The stock has been climbing for the last couple of weeks, and if it can form higher lows it may continue to push higher on the bullish trend.
- The stock is trading above the 50-day moving average (green) but below the 200-day moving average (blue), indicating the stock looks to be consolidating. The 50-day moving average may hold as an area of support while the 200-day moving average may act as an area of resistance.
- The Relative Strength Index (RSI) has been climbing for the last few days and now sits at 61. This shows that the stock is now seeing more buying pressure than selling pressure. If the RSI can hold above the middle line, the stock may continue on its bullish trend.
What’s Next For Boeing?
Boeing is starting to see some bullish movement once again after crossing above the $205 level. This area may continue to hold as support, and traders will want to see this hold if they want to see the stock keep pushing higher on the bullish trend.
Bulls are looking to see the stock hold the level as well as cross above the 200-day moving average as it forms higher lows. Bearish traders want to see the stock be unable to cross above the 200-day moving average and fall back below the 50-day moving average. Bears are then looking for the price to drop below the $205 level and hold it as an area of resistance.


Comments