Summary
- This technical analysis article is about Tesla's lower low third wave breaking.
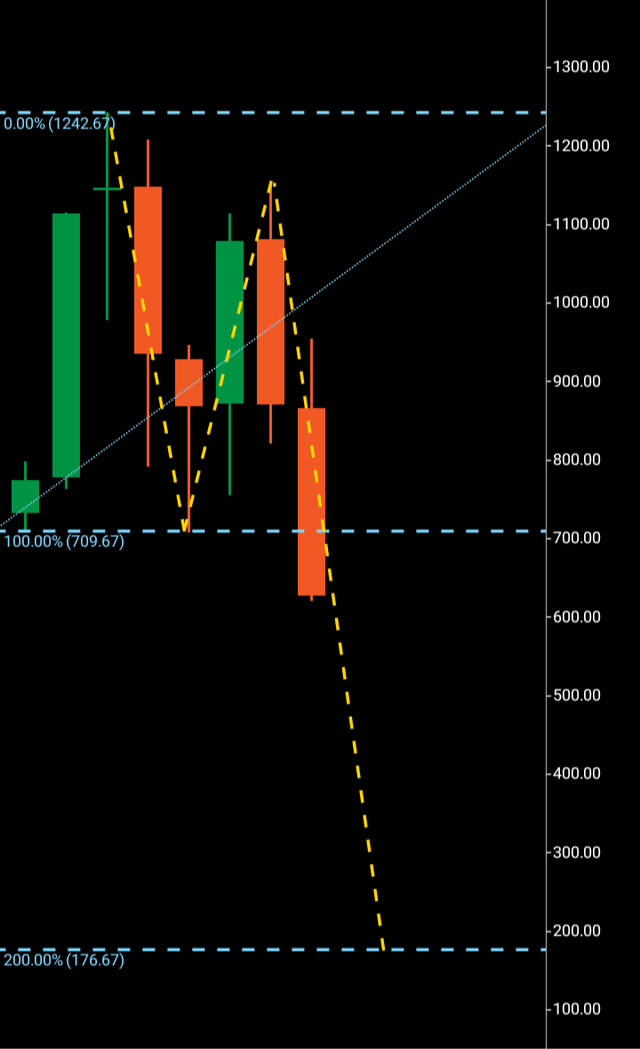
- There's a wave one 1242-708 and wave two 708-1152.
- There's a wave three breakdown from 1152 through 708.
- There's a lower low three wave pattern under 708 support within the daily structure.
- The target for Tesla is $176.
Tesla's (NASDAQ:TSLA) third wave has broken through in the current three wave pattern, with a focus on wave three replicating wave one to land at $176.
I have two young sons. One wants to be a vetand the other wants to build houses. I often mention that law is a good subject to study as it can provide an open-minded and educated approach to everyday scenarios we encounter. Unfortunately, I am greeted with looks of bemusement when I suggest this; I guess they're still a bit too young for that suggestion.
I find it intriguing how during the origins of modern civilization, human beings agreed on fundamental written laws that still stand today. It was the Romans that came up with the concepts of actus reus(guilty act) and mens rea(guilty mind). A criminal court must be able to prove both beyond reasonable doubt in order to secure a conviction.
Today, if one is accused of a crime, you have the right to silence in some societies. You may simply say "speak to my lawyer" and, by staying silent, not implicate yourself in even a matter as simple as, "I knew the person," for example. And you can wait for disclosure from the prosecution before building a defense. If you are accused of a crime, and you protest your innocence or invoke your right to remain silent, the prosecution must build a weight of evidence to prove that you committed the crime.
It's the argument between the prosecution and defense that goes a long way to determining the winner or loser in a case, and it is that way of thinking (the argument for or against the evidence) where a galaxy of interpretations and complex strategies by legal professionals come to the fore. There is an expanding of the mind to paint a picture of what may or may not be for or against the evidence in question. The importance of evidence also translates into many other fields in life, along with the skills of interpretation and argument.
In the case of Tesla's share price vs. future direction, we have clear evidence of a three wave structure, with the third wave making a lower low on the monthly chart below the rejections of waves one and two.
Tesla
Source: Chart created by the author with data taken from cTrader.
We can clearly see a bullish rejection at $1,242, with the price retracing to $708. This we now know is a wave one. The next is wave two at $1,152-$708. A break of $708 also confirms the wave three.
Now we can look at the argument as to where Tesla could be headed. I put it to you that the only printed directional bearing we have in front of us is the wave one at $1,242-$708. I would also put it to you that when a wave three breaks, two eventualities will happen - either the wave three will numerically copy wave one or fall further and land, in this case, at $176, or the wave three will fail at its task and take out $1,242 before completing the former.
However, there is clear evidence to argue that Tesla is going in the direction of $176. There is a wave one bearing, a wave two mismatch between buyers and sellers, and a wave three technical breakthrough. The $176 target is derived from the principles of the Ward Three Wave theory, which states that if waves one and two were able to continue between two separate price points before finding significant rejection, wave three will look with high probability to numerically copy wave one before it finds its significant rejection.
When I wrote the bookThe Ward Three Wave Theory, I wrote a chapter that focuses on waves within waves. It describes how to identify scenarios just like the one in front of us, where the wave three has broken above or below waves one and two. Switching backward from the monthly chart, identifying waves within waves can add credence to the fact that the third wave is breaking support with intent.
When we switch to the daily chart and look at the $708 region, we can also clearly see a lower low three wave pattern breaking down into the $600 price region. This is further evidence that perhaps this is not merely a flash dip into a macro wave three, but a tangible time frame that could add further evidence that Tesla's share price is making additional miniature three wave patterns within the direction of its macro third wave.
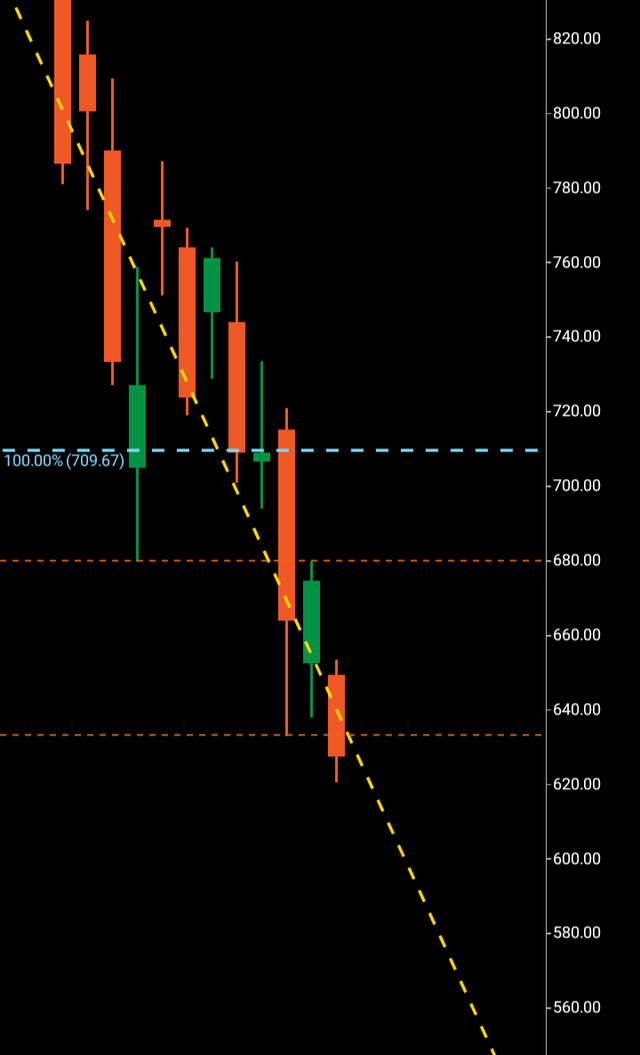
Tesla
Source: Chart created by the author with data taken from cTrader.
I would expect Tesla to complete its third wave within the next 90-120 days. The third wave has just broken through, with a target of $176 if wave three replicates the bearing set out by wave one. The share price could rise toward support at $708 and even challenge the highs of wave two before potentially dropping to complete the third wave. A move above $1,242 before touching $176 renders the third wave a fail.
I will be looking for bullish reversal three wave signals around that price area if the third wave completes. $176 might sound adventurous for Tesla's share price, but we must look at the evidence in front of us.
Comments