At one point, GameStop and AMC stocks seemed to serve as a counterpoint to the broad market. But neither has helped to avoid the pain of a correction in 2022. Here’s why.
At one point, ourWall Street Memes channel proposed an ideabased on observation of price action. Maybe GameStop stock and AMC stock could serve as a hedge against unfavorable market movements.
But the strategy has not been working all that well in the past six to ten months. Below, we take a closer look at why.

Why GME and AMC could be hedges
In August 2021, we wrote about GME and AMC being high negative beta stocks. All it means is that, historically, both names often moved in the opposite direction of beta — i.e., up if the broad stock market was down, and vice-versa.
The logic is that both stocks did not tend to behave consistently with economic or company-specific fundamentals — “ape resolve” was the main fuel instead. In fact, in case of panic, investors could shift to GME and AMC in search of alpha elsewhere in the market.
It is very hard to find stocks with negative beta. Gold miners can be an exception, although not always. Outside equities, treasuries tend to be inversely correlated with the S&P 500, albeit only modestly and not always in times of economic and market distress.
It has not been working
The bad news is that GME and AMC stocks have not lived up to those market hedging expectations. The following graph on GME, which captures all of the second half of 2021 plus the current year so far, helps to illustrate the idea.
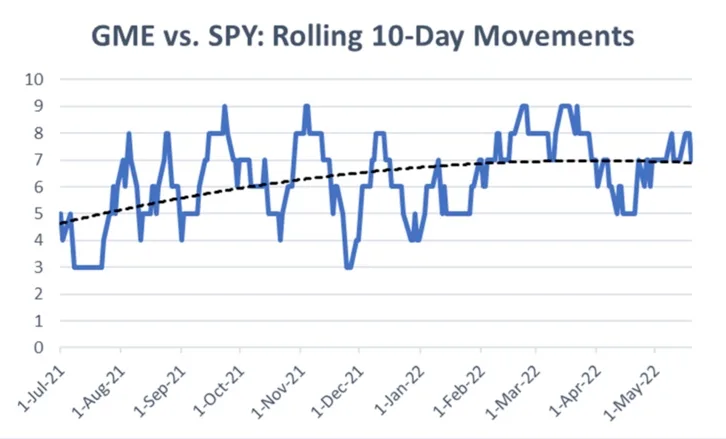
The chart shows the rolling ten-year relationship between GameStop stock and the S&P 500 (SPY). It simply counts the number of days in the previous 10 in which both GME and SPY moved in the same direction — that is: either up together or down together.
The higher the number on the graph, the more correlated both securities are. The lower the number, the better one served as diversification to the other. The black dotted line shows that GME has become progressively more correlated with SPY in the past 10 months or so.
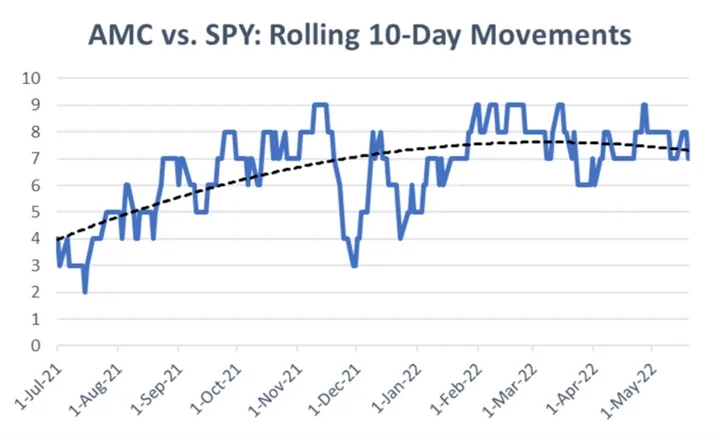
AMC has not been very different. If anything, this stock has been even more attached to the S&P 500, especially during the rough moments of bearishness in 2022. See the chart below. Notice how the black trend line starts at around 4 in July 2021 (good for diversification) but climbs sharply and nearly plateaus between 7 and 8 days.
There are a couple of reasons why this has happened. The first is that an environment of lower liquidity in the system may have dinged the “meme movement”. If so, fewer GME and AMC shareholders may have been willing to be diamond hands in the past few months compared to earlier in 2021.
The second possibility is that GME and AMC may have served as market hedges when the storms were less severe (i.e. tamer broad market declines in 2021). Once the S&P 500 took a more noticeable nosedive, nearly all stocks behaved similarly — including GME and AMC.
Comments