Apple Inc. shares were trading higher Thursday after the Federal Reserve held its rates constant but raised its inflation expectations for the years 2021-2023.
Seven Fed officials expect increases in rates in 2022, and 13 officials expect rate increases in 2023.
Apple was up 1.26% at the close Thursday at $131.79.
Apple Daily Chart Analysis
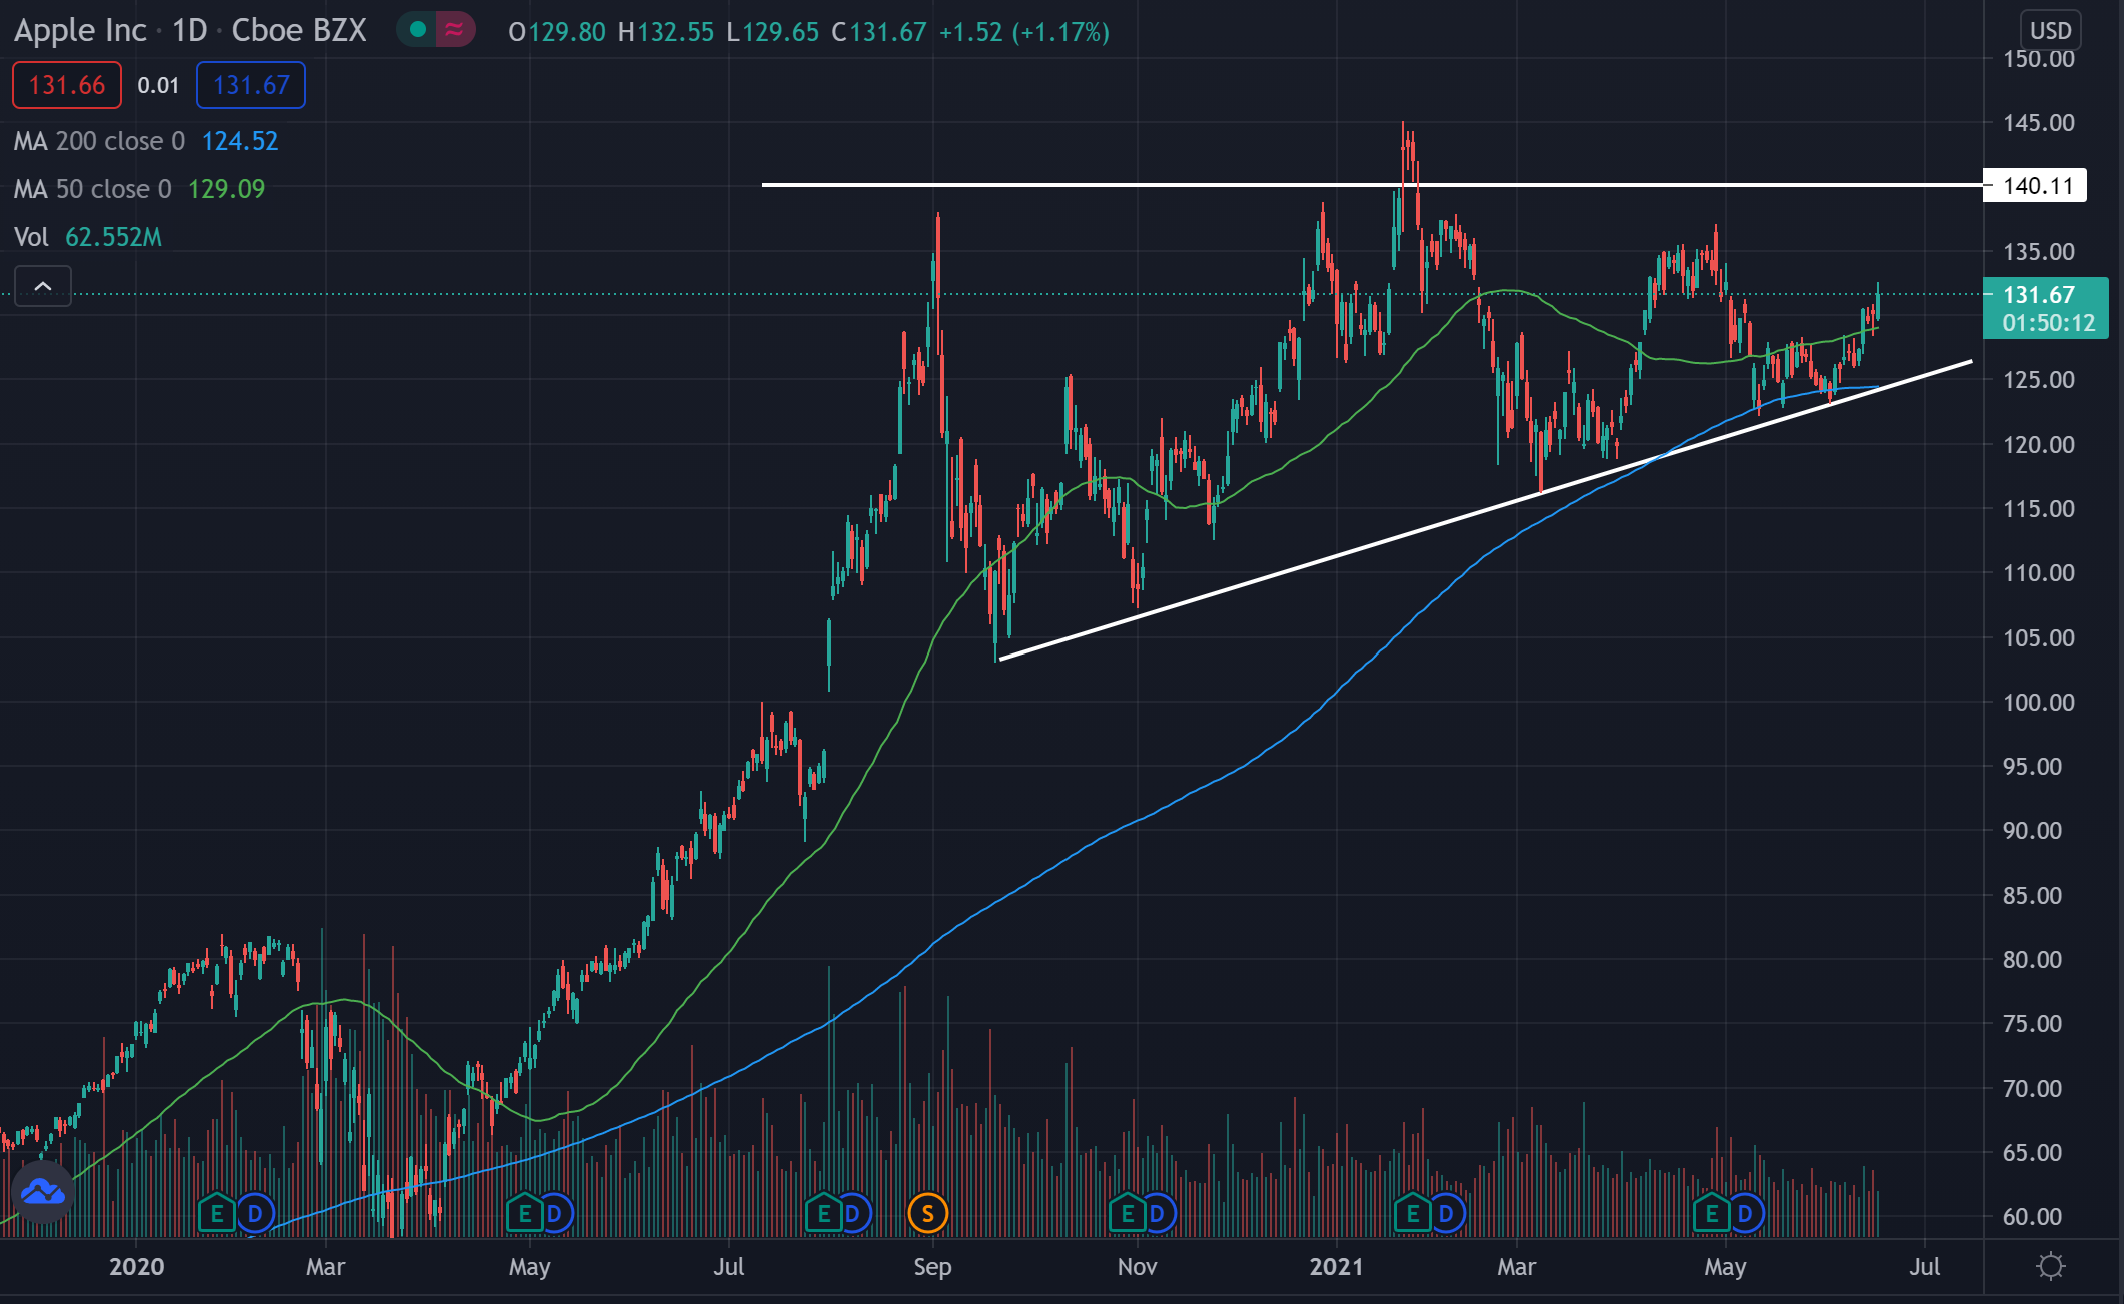
- Since September 2020, shares have been forming into what technical traders call an ascending triangle pattern.
- The stock is trading above both the 50-day moving average (green), and the 200-day moving average (blue), indicating sentiment in the stock is bullish.
- Each of these moving averages may hold as an area of support in the future.
Key Apple Levels To Watch
- Last week, the stock was able to bounce off support at the higher low trendline. The shares continue to form an ascending triangle pattern and could see a break out of the pattern in the weeks ahead.
- The higher low trendline has acted as support since September 2020 and may again in the future.
- The stock has been building up to a potential resistance mark near $140, as this was an area where the stock previously struggled to cross above.
What’s Next For Apple?
Bullish technical traders would like to see the stock continue to build higher lows and hold above the higher low trendline. Bulls would also like to see the stock cross above the $140 resistance level with a period of consolidation above the level.
Bearish technical traders would like to see the stock cross below the higher low trendline for a possible trend change. If the stock can cross below the moving averages, sentiment may turn bearish and the stock may see a strong downward push.
Apple Inc. is a top holding in the following ETFs:Technology Select Sector SPDR Fund,Fidelity MSCI Information Technology Index ETF,Vanguard Information Technology ETF,ishares U.S. Technology ETF,Direxion Daily Technology Bull 3X Shares.

Comments