Summary
- CEO Warren Buffett has bought back a large number of shares in 2020 in the first half of 2021.
- First half 2021 pre-tax operating earnings for manufacturing and service/retailing are up nicely over the first half of 2020.
- The stock portfolio is now in excess of $300 billion!

Introduction
My thesis is that Berkshire Hathaway(NYSE:BRK.A)(NYSE:BRK.B)is undervalued. CEO Warren Buffett has been taking advantage of this by buying back shares. He repurchased the equivalent of 80,998 “A” shares in 2020 which increased the ownership for existing shareholders by 5.2%. In the first half of this year, the 2Q2110-Qcash flow statement shows $12.6 billion in buybacks which is more than the $6.7 billion they spent in the first half of 2020. In some ways CEO Buffett can be reticent in terms of vocalizing things when the stock is cheap; his buyback actions speak louder than his words.
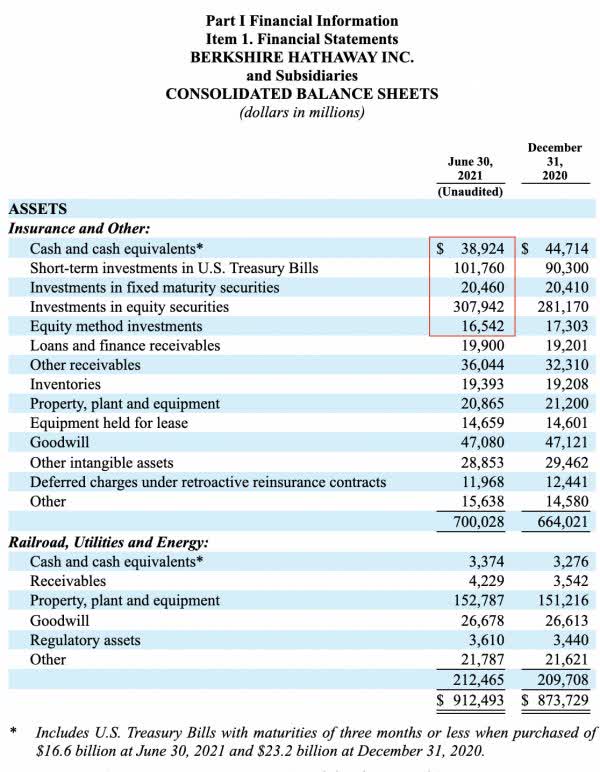
Looking at the 2Q21 10-Q balance sheet, the first 5 lines are a big part of our valuation estimate:
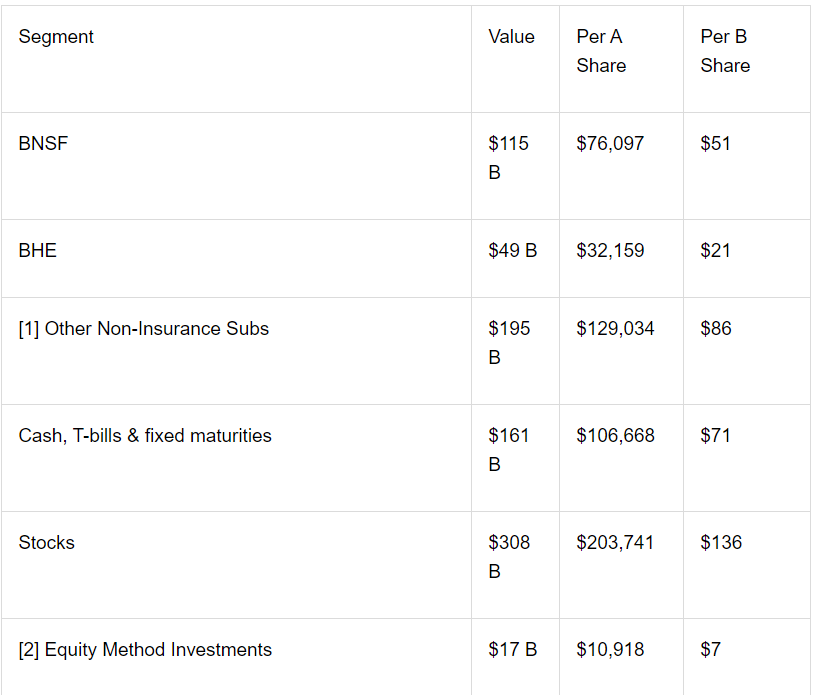
BNSF $115 Billion
BNSF has many similarities to Union Pacific(NYSE:UNP)including the approximate level of debt to enterprise value. The 2Q21 Union Pacific10-Qshows 652,122,933 shares outstanding as of July 16, 2021. Their share price for June 30, 2021 was $219.93 implying a June 30th market cap of $143.4 billion. I believe the market cap of BNSF is at least 80% of Union Pacific’s or $115 billion.
Berkshire Hathaway Energy (“BHE”) $48.6 Billion
We can use the prices at which BHE was repurchased for a valuation estimate but that information is getting dated. Per the BHE 2Q2110-Q, the last batch was during the first half of 2020 when 180,358 shares were repurchased for $126 million implying a share price of $698.61. The BHE 2Q21 10-Q shows 76,368,874 shares outstanding as of August 5, 2021, implying a market cap of $53.4 billion if the price from the first half of 2020 is still sound.
Berkshire’s 2Q21 10-Q says they own 91.1% meaning non-controlling interests own the rest. In other words, Berkshire owns $48.6 billion and non-controlling interests own $4.8 billion.
Other Non-Insurance Subsidiaries $195 Billion
The 2Q21 10-Q breaks down revenue and pre-tax earnings under Note 23, Business segment data:
Image Source: 2Q21 10-Q
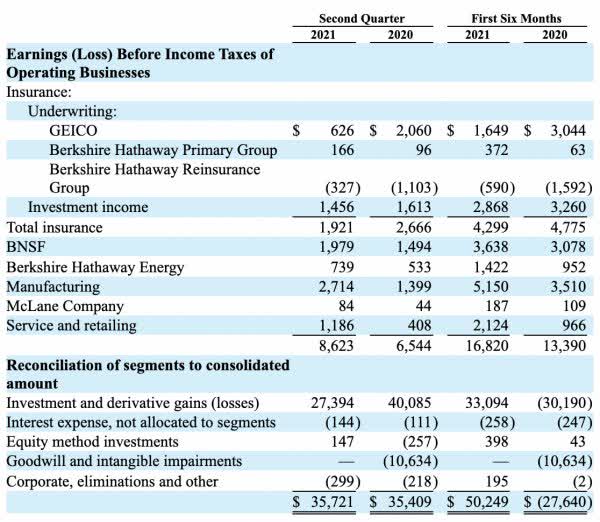
I like to use a pre-tax earnings multiple of 13 times for manufacturing, McLane and service/retailing. Their 1H21 pre-tax earnings were $5.2 billion, $0.2 billion and $2.1 billion, respectively. These numbers are a huge improvement over the first half of 2020! Summing them up and annualizing gives us $15 billion. Applying a multiple of 13 times brings us to $195 billion.
Cash, T-bills & Fixed Maturities $161.2 Billion
This is the sum of the first 3 lines on the balance sheet which are $38.9 billion in cash and equivalents plus $101.8 billion in T-bills plus $20.5 billion in fixed maturities.
Stocks $307.9 Billion
Per the 4th line in the balance sheet, we have $307.9 billion in stocks. Apple(NASDAQ:AAPL)is by far the biggest part of this portfolio. The13Fthrough June 2021 shows $121.5 billion in Apple stock.
Equity Method Investments $16.5 Billion
The 5th line of the balance sheet shows $16.5 billion here. Note 5, Equity method investments, on the 2020 10-K showed that the carrying value of $13.3 billion for Kraft Heinz(NASDAQ:KHC)on the balance sheet was $2 billion higher than the fair value of $11.3 billion. However note 5 on the 2Q21 10-Q shows that the fair value went up to the same range as the carrying value so we don’t need to make any adjustments here.
Deferred Tax Liability $(27) Billion
Note 18, Income taxes, isn’t as detailed on the 10-Qs as on the 10-Ks. I’m sticking with the $27 billion net investment tax liability estimate used in my February 2021article.
Non-Controlling Interests $(3.6) Billion
The balance sheet shows $8.4 billion in non-controlling interests but we attributed $4.8 billion to BHE investors. As such, there is another $3.6 billion or so of non-controlling interests outside of BHE.
Other Considerations $0
I treat the insurance operations and the float liability as a wash. I can see why fastidious accountants aren’t crazy about this but I don’t think it makes a huge difference to the overall valuation whether or not these are broken out separately.
Valuation Chart
The 2Q21 says that on an equivalent Class A common stock basis, there were 1,511,229 shares outstanding as of June 30, 2021:
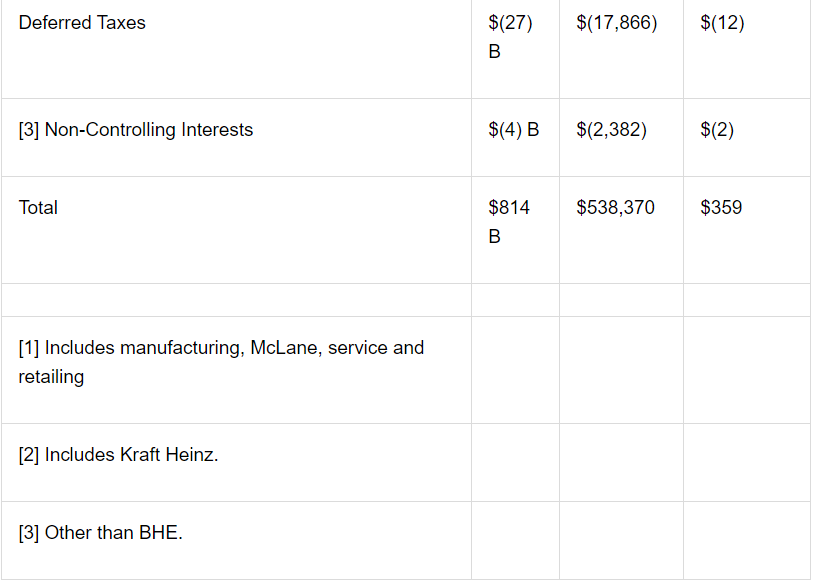
Here is a more visual interpretation:
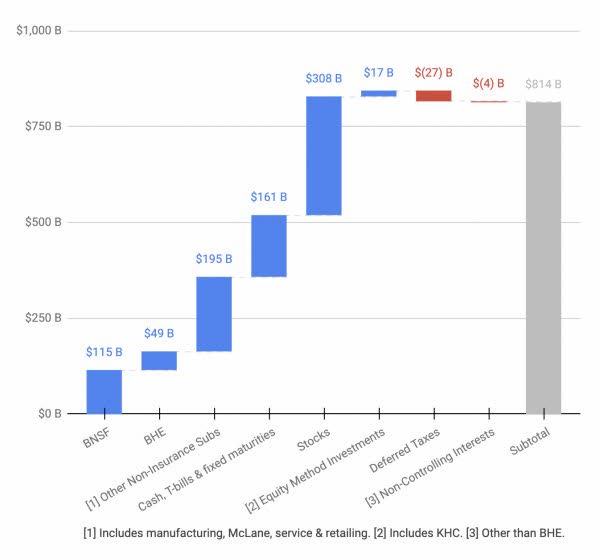
Of course the above chart is somewhere near the middle of my range. Rather than thinking about a valuation of $814 billion exactly, I think it could be approximately $50 billion higher or lower such that my range with round numbers to the nearest $5 billion is about $765 billion to $865 billion.
Given the August 23rd (BRK.A) share price of $425,000, and the 1,511,229 class A share equivalents, the implied market cap is $642 billion. Seeing as the market cap is well below my valuation range, I think the stock is priced very reasonably for long-term investors.
Some think it will be calamitous when CEO Buffett retires but he has built the company with a stable architecture that should hold up well for years to come.
Comments