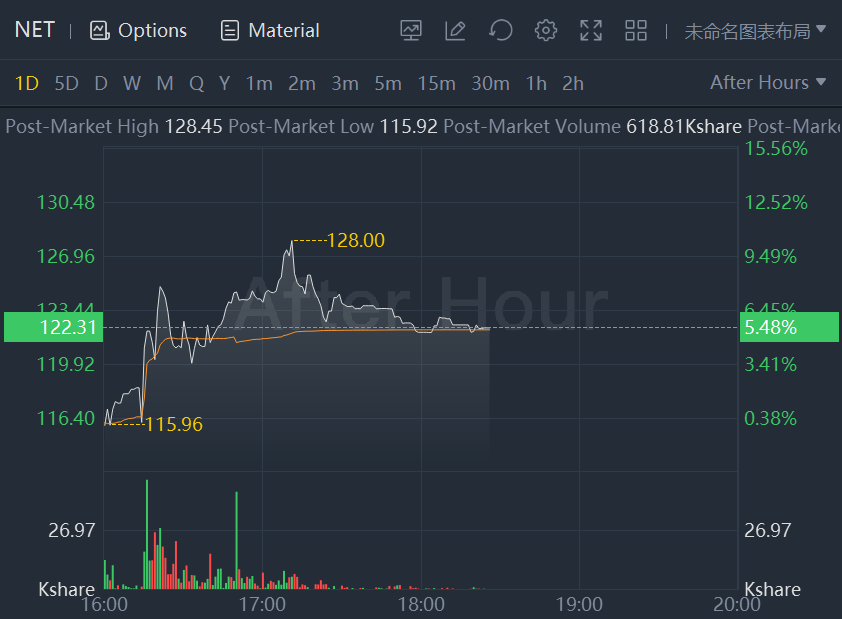
Cloudflare shares jumped more than 5% in extended trading after its quarterly earnings and revenue came in stronger than expected. Cloudflare also announced that it acquired Vectrix to assist businesses in gaining control of their applications.
Cloudflare reported quarterly sales of $193.60 million which beat the analyst consensus estimate of $184.90 million by 4.71 percent. This is a 53.74 percent increase over sales of $125.93 million the same period last year.
Cloudflare, Inc., the security, performance, and reliability company helping to build a better Internet, today announced financial results for its fourth quarter and fiscal year ended December 31, 2021.
“We had a most excellent 2021, capping off the year with fourth quarter revenue growth up 54% year-over-year. The full year represented a 52% year-over-year increase in revenue growth and a 71% year-over-year increase in large customer growth. It was also the fifth straight year we achieved 50 percent, or greater, compounded growth,” said Matthew Prince, co-founder & CEO of Cloudflare. “Our continued success is fueled by a culture of relentless innovation on top of a highly scalable platform. That’s why we’re uniquely positioned to extend our network, introduce new Zero Trust capabilities, and grow our total addressable market. We’ve never been more motivated to take on this huge opportunity as corporate networks transition to the cloud, and developers line-up to build on our edge.”
Fourth Quarter Fiscal 2021 Financial Highlights
- Revenue: Total revenue of $193.6 million representing an increase of 54% year-over-year.
- Gross Profit: GAAP gross profit was $151.1 million or 78.0% gross margin, compared to $96.9 million or 76.9%, in the fourth quarter of 2020. Non-GAAP gross profit was $153.3 million or 79.2% gross margin, compared to $98.3 million, or 78.1%, in the fourth quarter of 2020.
- Operating Income (Loss): GAAP loss from operations was $41.1 million, or 21.2% of total revenue, compared to $24.7 million, or 19.6% of total revenue, in the fourth quarter of 2020. Non-GAAP income from operations was $2.2 million, or 1.2% of total revenue, compared to a loss from operations of $5.5 million, or 4.3% of total revenue, in the fourth quarter of 2020.
- Net Income (Loss): GAAP net loss was $77.5 million, compared to $34.0 million in the fourth quarter of 2020. GAAP net loss per basic and diluted share was $0.24 compared to $0.11 in the fourth quarter of 2020. Non-GAAP net income was $0.1 million, compared to non-GAAP net loss of $7.4 million in the fourth quarter of 2020. Non-GAAP net income per diluted share was $0.00, compared to non-GAAP net loss per share of $0.02 in the fourth quarter of 2020.
- Cash Flow: Net cash flow from operating activities was $40.6 million, compared to negative $8.8 million for the fourth quarter of 2020. Free cash flow was $8.6 million, or 4% of total revenue, compared to negative $23.5 million, or 19% of total revenue, in the fourth quarter of 2020.
- Cash, cash equivalents, and available-for-sale securities were $1,821.8 million as of December 31, 2021.
Full Year 2021 Financial Highlights
- Revenue: Total revenue of $656.4 million representing an increase of 52% year-over-year.
- Gross Profit: GAAP gross profit was $509.3 million or 77.6% gross margin, compared to $330.0 million, or 76.6%, in fiscal 2020. Non-GAAP gross profit was $515.9 million, or 78.6% gross margin, compared to $334.6 million, or 77.6%, in fiscal 2020.
- Operating Loss: GAAP loss from operations was $127.7 million, or 19.5% of total revenue, compared to $106.8 million or 24.8% of total revenue, in fiscal 2020. Non-GAAP loss from operations was $7.0 million, or 1.1% of total revenue, compared to $33.9 million, or 7.9% of total revenue, in fiscal 2020.
- Net Loss: GAAP net loss was $260.3 million compared to $119.4 million for fiscal 2020. GAAP net loss per share was $0.83, compared to $0.40 for fiscal 2020. Non-GAAP net loss was $15.1 million compared to $35.1 million for fiscal 2020. Non-GAAP net loss per share was $0.05, compared to $0.12 for fiscal 2020.
- Cash Flow: Net cash flow from operating activities was $64.6 million, compared to negative $17.1 million for fiscal 2020. Free cash flow was negative $43.1 million, or 7% of total revenue, compared to negative $92.1 million, or 21% of total revenue, for fiscal 2020.
The section titled “Non-GAAP Financial Information” below describes our usage of non-GAAP financial measures. Reconciliations between historical GAAP and non-GAAP information are contained at the end of this press release following the accompanying financial data.
Financial Outlook
The following forward-looking statements regarding its financial outlook are subject to substantial uncertainty as a result of the ongoing COVID-19 pandemic, reflect our estimates as of February 10, 2022 regarding the impact of the pandemic on our operations, and are highly dependent on numerous factors that we may not be able to predict or control, including, among others: the duration, spread, and severity of the pandemic; actions taken by governments and businesses in response to the pandemic and the resulting impact on our customers, vendors, and partners; the timing of administering COVID-19 vaccines around the world and the long-term efficacy of these vaccines; the impact of the pandemic on global and regional economies and economic activity generally; our ability to continue operating in impacted areas; and customer demand and spending patterns.
For the first quarter of fiscal 2022, the company expect:
- Total revenue of $205.0 to $206.0 million
- Non-GAAP income from operations of $0.5 to $1.5 million
- Non-GAAP net income per share of $0.00 to $0.01, utilizing weighted average common shares outstanding of approximately 348 million
For the full year fiscal 2022, the company expect:
- Total revenue of $927.0 to $931.0 million
- Non-GAAP income from operations of $10.0 to $14.0 million
- Non-GAAP net income per share of $0.03 to $0.04, utilizing weighted average common shares outstanding of approximately 352 million

Comments