Bilibili announced its unaudited financial results for the fourth quarter and fiscal year ended December 31, 2021. Bilibili Q4 net revenues reached RMB5,780.8 million (US$907.1 million), a 51% increase from the same period in 2020. Its Q4 MAUs reached 271.7 million, and mobile MAUs reached 252.4 million, representing increases of 35% and 35%, respectively, from the same period in 2020.
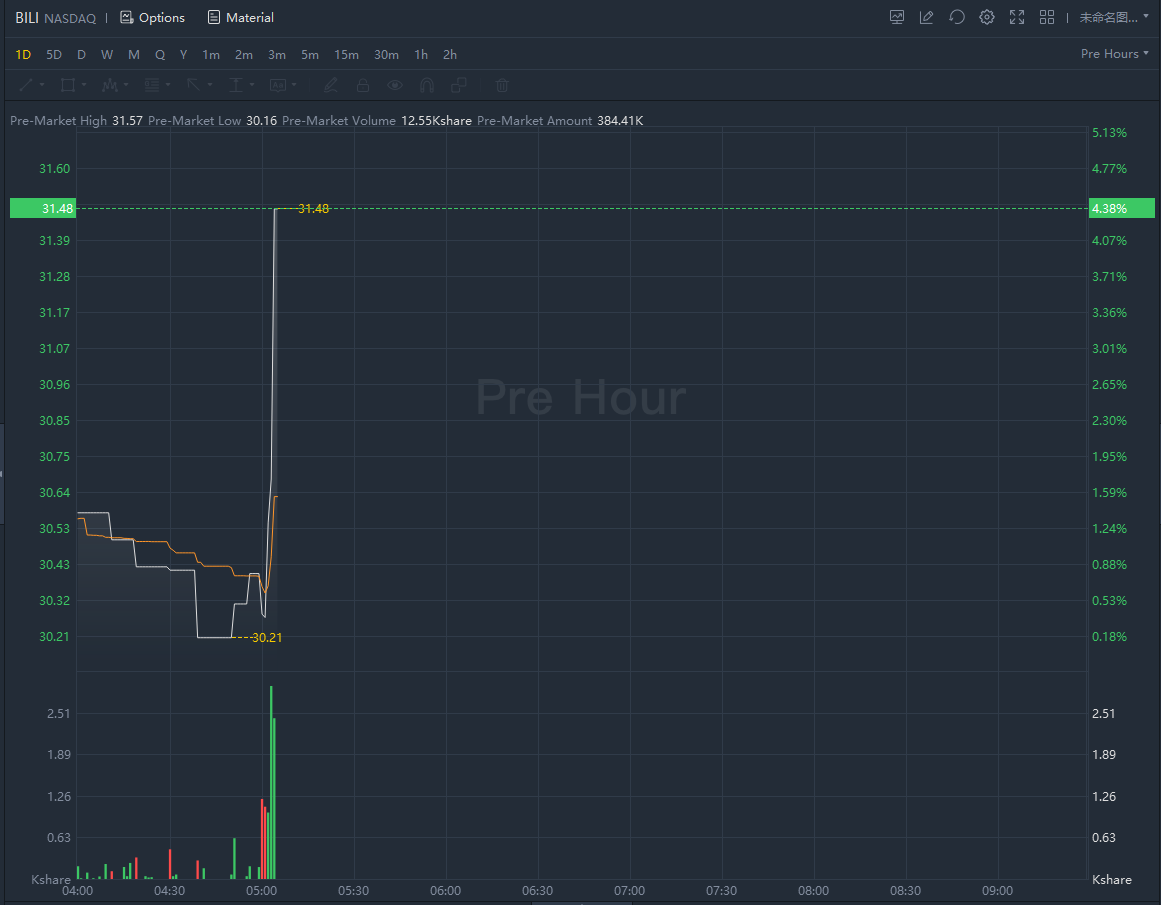
Bilibili stock rose 4% in premarket trading.
Fourth Quarter 2021 Highlights:
- Total net revenuesreached RMB5,780.8 million (US$907.1 million), a 51% increase from the same period in 2020.
- Average monthly active users (MAUs)reached 271.7 million, and mobile MAUs reached 252.4 million, representing increases of 35% and 35%, respectively, from the same period in 2020.
- Average daily active users (DAUs)reached 72.2 million, a 34% increase from the same period in 2020.
- Average monthly paying users (MPUs1)reached 24.5 million, a 37% increase from the same period in 2020.
“Our growth has been substantial with MAU more than doubled, topline near tripled in the past three years,” said Mr. Rui Chen, chairman and chief executive officer of Bilibili. “We ended 2021 with fourth quarter MAUs reaching 271.7 million, up 35% year-over-year. Our community also remained highly active and engaged in the fourth quarter, with a 34% year-over-year increase in DAUs and users spending a daily average of 82 minutes on our platform. With the videolization tailwind, our growth momentum remains strong. Stepping into 2022, we are committed to our healthy growth strategy to further expand our user base and we will actively explore commercialization opportunities within our tight bonded video community. At the same time, we will focus on strengthening our execution and improving operating efficiency across our businesses.”
“Our total revenues reached RMB5.8 billion in the fourth quarter, and RMB19.4 billion for the full year, representing growth of 51% and 62% year-over-year, respectively,” said Mr. Sam Fan, chief financial officer of Bilibili. “In the fourth quarter, our advertising revenues increased by 120%, leading our topline growth. MPUs also grew to nearly 25 million in the fourth quarter, up 37% year-over-year, and our paying ratio increased to 9.0%. Overall, our commercialization capabilities improved consistently with revenue per MAU in 2021 increased by 20% year-over-year. Looking ahead, while committing to our growth strategy, we will be prudent with our expenses and aim to narrow our loss margins in 2022. Our cash reserves remained healthy with RMB30.2 billion at the end of 2021, providing a strong cushion in the evolving industry landscape.”
Fourth Quarter 2021 Financial Results
Total net revenues.Total net revenues were RMB5,780.8 million (US$907.1 million), representing an increase of 51% from the same period of 2020.
Mobile games.Revenues from mobile games were RMB1,295.4 million (US$203.3 million), representing an increase of 15% from the same period of 2020. The increase was primarily due to the popularity of our newly launched mobile games.
Value-added services (VAS).Revenues from VAS were RMB1,894.5 million (US$297.3 million), representing an increase of 52% from the same period of 2020, mainly attributable to the Company’s enhanced monetization efforts, led by an increased number of paying users for the Company’s value-added services including the premium membership program, live broadcasting services and other value-added services.
Advertising.Revenues from advertising were RMB1,587.6 million (US$249.1 million), representing an increase of 120% from the same period of 2020. This increase was primarily attributable to further recognition of Bilibili’s brand name in China’s online advertising market, as well as Bilibili’s improved advertising efficiency.
E-commerce and others.Revenues from e-commerce and others were RMB1,003.3 million (US$157.4 million), representing an increase of 35% from the same period of 2020, primarily attributable to the increase in sales of products through the Company’s e-commerce platform.
Cost of revenues.Cost of revenues was RMB4,683.0 million (US$734.9 million), representing an increase of 62%, compared with the same period of 2020. Revenue-sharing cost, a key component of cost of revenues, was RMB2,428.5 million (US$381.1 million), representing an increase of 91% from the same period in 2020, primarily due to an increase in revenue-sharing payments made to hosts and content creators and an increase in payments made to distribution channels as we expanded our mobile games and VAS offerings.
Gross profit.Gross profit was RMB1,097.8 million (US$172.3 million), representing an increase of 16% from the same period in 2020.
Total operating expenses.Total operating expenses were RMB3,097.3 million (US$486.0 million), representing an increase of 68% from the same period of 2020.
Sales and marketing expenses.Sales and marketing expenses were RMB1,761.6 million (US$276.4 million), representing a 73% increase year-over-year. The increase was primarily attributable to increased channel and marketing expenses to promote Bilibili’s apps and brand, as well as increased promotional expenses for the Company’s mobile games.
General and administrative expenses.General and administrative expenses were RMB538.1 million (US$84.4 million), representing a 57% increase year-over-year. The increase was primarily due to increased headcount in general and administrative personnel, increased share-based compensation expenses, increased allowance for doubtful accounts, higher rental expenses and other general and administrative expenses.
Research and development expenses.Research and development expenses were RMB797.6 million (US$125.2 million), representing a 65% increase year-over-year. The increase was primarily due to increased headcount in research and development personnel and increased share-based compensation expenses.
Loss from operations.Loss from operations was RMB1,999.5 million (US$313.8 million), compared with RMB903.4 million in the same period of 2020.
Income tax expense.Income tax expense was RMB32.8 million (US$5.1 million), compared with RMB14.8 million in the same period of 2020.
Net loss.Net loss was RMB2,095.8 million (US$328.9 million), compared with RMB843.7 million in the same period of 2020.
Adjusted net loss2.Adjusted net loss, which is a non-GAAP measure that excludes share-based compensation expenses, amortization expense related to intangible assets acquired through business acquisitions, income tax related to intangible assets acquired through business acquisitions and (gain)/loss on fair value change in investments in publicly traded companies, was RMB1,659.8 million (US$260.5 million), compared with RMB691.5 million in the same period of 2020.
Basic and diluted EPS and adjustedbasic and diluted EPS2. Basic and diluted net loss per share were RMB5.34 (US$0.84), compared with RMB2.34 in the same period of 2020. Adjusted basic and diluted net loss per share were RMB4.22 (US$0.66), compared with RMB1.91 in the same period of 2020.
Cash and cash equivalents, time deposits and short-term investments.As of December 31, 2021, the Company had cash and cash equivalents, time deposits, and short-term investments of RMB30.2 billion (US$4.7 billion), compared with RMB12.8 billion as of December 31, 2020.
Recent Development
In November 2021, the Company completed an offering of convertible senior notes (the “Notes”) due 2026 in aggregate principal amount of US$1,600 million. The Company plans to use the net proceeds from the Notes for enriching its content offerings, investing in research and development, and other general corporate purposes.
Fiscal Year 2021 Financial Results
Total net revenues.Total net revenues were RMB19.4 billion (US$3.0 billion), representing an increase of 62% from 2020.
Mobile games.Revenues from mobile games were RMB5.1 billion (US$798.9 million), representing an increase of 6% from 2020.
Value-added services (VAS).Revenues from VAS were RMB6.9 billion (US$1.1 billion), representing an increase of 80% from 2020, mainly attributable to the Company’s enhanced monetization efforts, led by an increase in the number of paying users for the Company’s value-added services including the premium membership program, live broadcasting services and other value-added services.
Advertising.Revenues from advertising were RMB4.5 billion (US$709.8 million), representing an increase of 145% from 2020. This increase was primarily attributable to further recognition of Bilibili’s brand name in China’s online advertising market as well as improvement of Bilibili’s advertising efficiency.
E-commerce and others.Revenues from e-commerce and others were RMB2.8 billion (US$444.8 million), representing an increase of 88% from 2020, primarily attributable to the increase in sales of products through the Company’s e-commerce platform.
Cost of revenues.Cost of revenues increased by 67% to RMB15.3 billion (US$2.4 billion), compared with RMB9.2 billion in 2020. Revenue-sharing cost,a key component of cost of revenues, was RMB7.7 billion (US$1.2 billion), representing an increase of 77% from 2020.
Gross profit.Gross profit was RMB4.0 billion (US$634.5 million), representing an increase of 42% from 2020.
Total operating expenses.Total operating expenses were RMB10.5 billion (US$1.6 billion), representing an increase of 75% from 2020.
Sales and marketing expenses.Sales and marketing expenseswere RMB5.8 billion (US$909.3 million), representing a 66% increase year-over-year. The increase was primarily attributable to the increased channel and marketing expenses associated with Bilibili’s apps and brand, as well as increased promotional expenses for the Company’s mobile games and increased headcount in sales and marketing personnel.
General and administrative expenses.General and administrative expenseswere RMB1.8 billion (US$288.3 million), representing an 88% increase year-over-year. The increase was mainly attributable to increased headcount in general and administrative personnel, increased share-based compensation expenses, increased allowance for doubtful accounts, higher rental expenses and other general and administrative expenses.
Research and development expenses.Research and development expenseswere RMB2.8 billion (US$445.6 million), representing an 88% increase year-over-year. The increase was primarily due to increased headcount in research and development personnel, increased share-based compensation expenses and other research and development expenses.
Loss from operations.Loss from operations was RMB6.4 billion (US$1.0 billion), compared with RMB3.1 billion in 2020.
Income tax expense.Income tax expense was RMB95.3 million (US$15.0 million), compared with RMB53.4 million in 2020.
Net loss.Net loss was RMB6.8 billion (US$1.1 billion), compared with RMB3.1 billion in 2020.
Adjusted net loss2.Adjusted net loss, which is a non-GAAP measure that excludes share-based compensation expenses, amortization expense related to intangible assets acquired through business acquisitions, income tax related to intangible assets acquired through business acquisitions and (gain)/loss on fair value change in investments in publicly traded companies, was RMB5.5 billion (US$862.7 million) compared with RMB2.6 billion in 2020.
Basic and diluted EPS and Adjusted basic and diluted EPS2.Basic and diluted net loss per share were RMB17.87 (US$2.80), compared with RMB8.71 in 2020. Adjusted basic and diluted net loss per share were RMB14.42 (US$2.26), compared with RMB7.40 in 2020.
Notes to Unaudited Financial Information
The unaudited financial information disclosed in this press release is preliminary. The audit of the financial statements and related notes to be included in the Company’s annual report on Form 20-F for the year ended December 31, 2021 is still in progress. In addition, because an audit of the Company’s internal controls over financial reporting in connection with section 404 of the Sarbanes-Oxley Act of 2002 has not yet been completed, the Company makes no representation as to the effectiveness of those internal controls as of December 31, 2021.
Adjustments to the financial statements may be identified when the audit work is completed, which could result in significant differences between the Company’s audited financial statements and this preliminary unaudited financial information.
Share Repurchase Program of the Company and Proposed Share Purchase by Management
The Company announced today that its board of directors has authorized a share repurchase program under which the Company may repurchase up to US$500 million of its ADSs for the next 24 months. The Company’s proposed repurchases may be made from time to time in the open market at prevailing market prices, in privately negotiated transactions, in block trades and/or through other legally permissible means, depending on market conditions and in accordance with applicable rules and regulations. The Company plans to fund the repurchases from its existing cash balance.
In addition, Mr. Rui Chen, chairman and chief executive officer of Bilibili, has informed the Company of his intention to use his personal funds to purchase up to US$10 million of the Company’s ADSs in the open market for the next 24 months.
Outlook
For the first quarter of 2022, the Company currently expects net revenues to be between RMB5.3 billion and RMB5.5 billion.
The above outlook is based on the current market conditions and reflects the Company’s preliminary estimates, which are all subject to various uncertainties, including those related to the ongoing COVID-19 pandemic.
1The paying users refer to users who make payments for various products and services on our platform, including purchases in games and payments for VAS (excluding purchases on our e-commerce platform). A user who makes payments across different products and services offered on our platform using the same registered account is counted as one paying user and we add the number of paying users of Maoer toward our total paying users without eliminating duplicates.
2Adjusted net loss and adjusted basic and diluted EPS are non-GAAP financial measures. For more information on non-GAAP financial measures, please see the section of “Use of Non-GAAP Financial Measures” and the table captioned “Unaudited Reconciliations of GAAP and Non-GAAP Results” set forth at the end of this announcement.
Comments