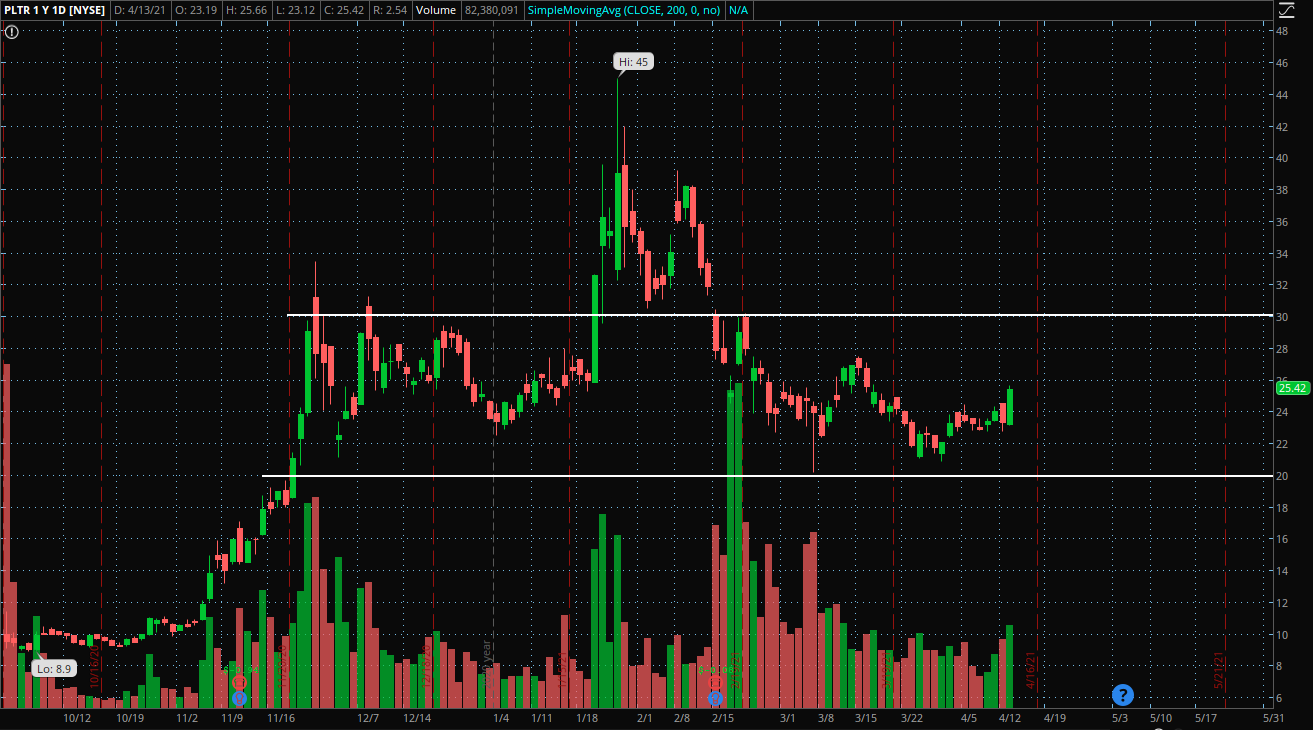
Palantir closed up 8.91% at $25.42 Tuesday.
Palantir Daily Chart Analysis:The daily chart shows Palantir is trading in a channel. The stock looks to have broken above a head-and-shoulders pattern previously written about.
The chart looks to have support near the $20 level. This is a previous resistance level that the stock was able to break out of, then later found support near multiple times. This area may hold as support again in the future.
The stock has shown resistance near the $30 level multiple times. The stock was able to break above this level for a time, but when it fell back to the level to test it as support, it failed to hold.
What’s Next For Palantir?Bullish technical traders would like to see the stock form higher lows up to the resistance level. If the price is able to cross above the resistance level and consolidate, the stock may be able to see a further upwards push in the future.
Bearish technical traders would like to see the stock fall back to the support level and fail to hold. A cross below the support level with some consolidation might allow the stock to see a further push downwards.

Comments