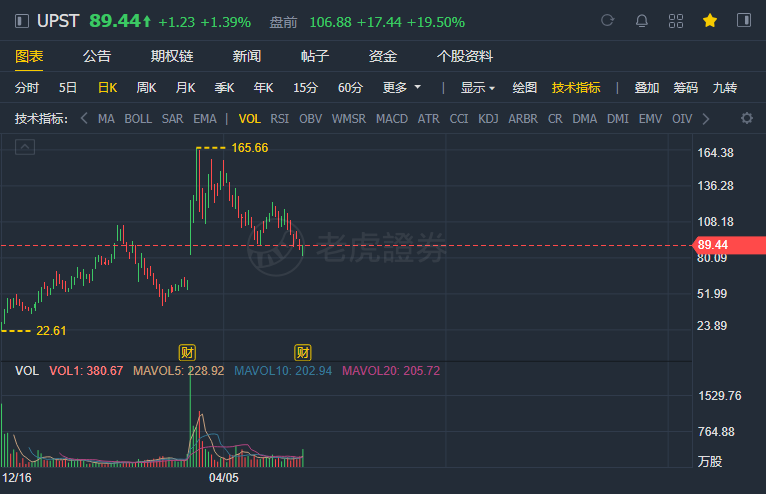
(May 12) Upstart rose nearly 20% in premarket trading. Eaelier, Upstart posted Q1 earning. It EPS beats by $0.07, beats on revenue.
- Upstart Q1 Non-GAAP EPS of $0.22 beats by $0.07; GAAP EPS of $0.11 beats by $0.01.
- Revenue of $121.35M (+89.6% Y/Y) beats by $5.29M.
- Bank partners originated 169,750 loans, totaling $1.73 billion, across our platform in the first quarter, up 102% from the same quarter of the prior year.
- Conversion on rate requests was 22% in the first quarter of 2021, up from 14% in the same quarter of the prior year.
- adjusted EBITDA margin was 17% of total revenue, from 6% in the first quarter of 2020.
- Q2 2021 Outlook:Revenue of $150 to $160 million; Contribution Margin of approximately 44%; Net Income of $8 to $12 million; Adjusted Net Income of $21 to $25 million; Adjusted EBITDA of $23 to $27 million.
“Upstart is delivering a combination of growth and profits that is rare in FinTech and in the technology industry overall,” saidDave Girouard, CEO of Upstart. He added, “The advantages of AI in lending are becoming more apparent by the day and Upstart is synonymous with this newly emerging category.”
First Quarter 2021 Financial Highlights
- Revenue. Total revenue was $121 million, an increase of 90% from the first quarter of 2020. Total fee revenue was $116 million, an increase of 71% year-over-year.
- Transaction Volume and Conversion Rate. Bank partners originated 169,750 loans, totaling $1.73 billion, across our platform in the first quarter, up 102% from the same quarter of the prior year. Conversion on rate requests was 22% in the first quarter of 2021, up from 14% in the same quarter of the prior year.
- Income from Operations. Income from operations was $15.6 million, from $0.6 million the prior year.
- Net Income and EPS. GAAP net income was $10.1 million, up from $1.5 million in the same quarter of the prior year. Adjusted net income was $19.9 million, up from $3.4 million in the same quarter of the prior year. Accordingly, GAAP diluted earnings per share was $0.11, and diluted adjusted earnings per share was $0.22 based on the weighted-average common shares outstanding during the period.
- Contribution Profit. Contribution profit was $55.8 million, up 117% from in the first quarter of 2020, with a contribution margin of 48% compared to a 38% contribution margin in the first quarter of 2020.
- Adjusted EBITDA. Adjusted EBITDA was $21.0 million, up 472% year-over-year. The first quarter 2021 adjusted EBITDA margin was 17% of total revenue, from 6% in the first quarter of 2020.
Financial Outlook
For the second quarter of 2021, Upstart expects:
- Revenue of $150 to $160 million
- Contribution Margin of approximately 44%
- Net Income of $8 to $12 million
- Adjusted Net Income of $21 to $25 million
- Adjusted EBITDA of $23 to $27 million
- Basic Weighted-Average Share Count of approximately 77.0 million shares
- Diluted Weighted-Average Share Count of approximately 94.9 million shares
For the 2021 fiscal year, Upstart now expects:
- Revenue of approximately $600 million (vs prior guidance of $500 million)
- Contribution Margin of approximately 42% (vs prior guidance of 41%)
And continues to expect:
- Adjusted EBITDA Margin of approximately 10%
Upstart has not reconciled the forward-looking non-GAAP measures above to comparable forward-looking GAAP measures because of the potential variability and uncertainty of incurring these costs and expenses in the future. Accordingly, a reconciliation is not available without unreasonable effort.
Key Operating Metrics and Non-GAAP Financial Measures
For a description of our key operating measures, please see the section titled “Key Operating Metrics” below.
Reconciliations of non-GAAP financial measures to the most directly comparable financial results as determined in accordance with GAAP are included at the end of this press release following the accompanying financial data. For a description of these non-GAAP financial measures, including the reasons management uses each measure, please see the section titled "About Non-GAAP Financial Measures” below.

Comments