A recent report that Virgin Galactic Holdings, Inc.(NYSE:SPCE) could sendits founder Sir Richard Branson to space as soon as July 4 has caught the eye of traders and investors. If the company is able to complete the task, Branson would beat Jeff Bezos, who plans to fly to outer space on July 20 aboard Blue Origin’s New Shepard vehicle.
Virgin Galactic's stock was in desperate need of a sentiment change after pushing back its last test flight that was scheduled for February to May. In the months that followed the company’s Feb. 12 announcement, Virgin Galactic’s stock lost over 70% of its value, retracing all the way down to $14.27 before hitting a bottom.
Virgin Galactic’s stock has turned around, however, since completing a successful test flight on May 22 and looks set to fly higher.
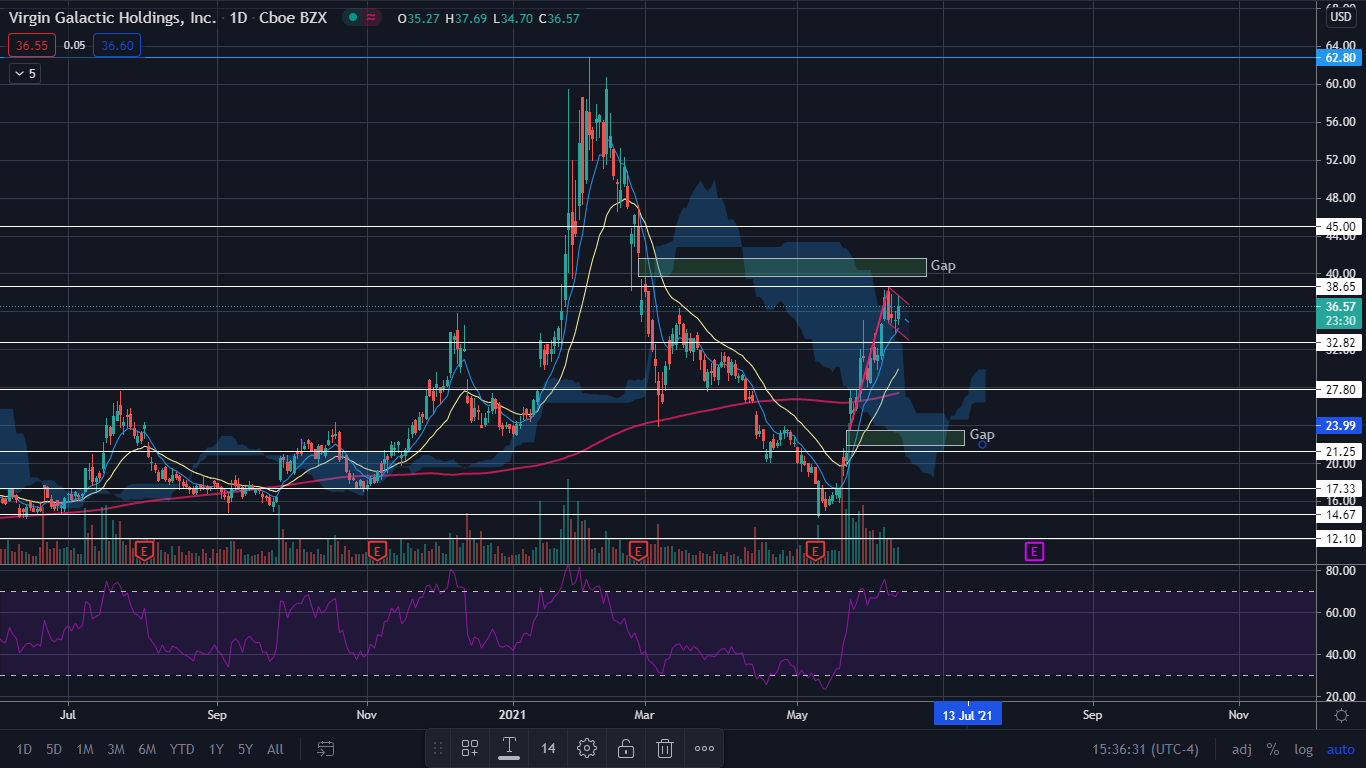
The Virgin Galactic Chart:Virgin Galactic shot up over 147% between its May 11 bottom and June 9 and on May 24, the first trading day after its successful test flight, gapped up almost 20% and never looked back. It has since been trading in a daily uptrend, making consistently higher highs and higher lows. On June 9, the stock hit a high of $38.65, just shy of its overhead gap in the $39 to $41 range, before consolidating.
Because gaps fill 90% of the time, it's likely Virgin Galactic will fill its upper gap in the future. There is a lower gap that was created on May 24 between $21.84 and $23.55, too, which could make bulls nervous. Virgin Galactic is trading about 60% above the lower gap, which makes the chances of filling it in the near future less likely.
In its consolidation, Virgin Galactic has set up a daily bull flag with the pole created between May 24 and June 9 and the flag made between June 10 and Monday.
On Monday, Virgin Galactic’s stock attempted to break up bullish from the flag but wicked from it. The stock could trade slightly lower within the flag for longer before gaining the power to break bullishly.
Virgin Galactic is trading above both the eight-day and 21-day exponential moving averages (EMAs) with the eight-day EMA trending above the 21-day EMA, both of which are bullish indicators. The stock is also trading up about 36% above the 200-day simple moving average, which indicates overall sentiment in Virgin Galactic is bullish.
Bulls want to see bullish volume break Virgin Galactic’s stock up out of the bull flag pattern and for the stock to continue rising to fill the overhead gap. If the stock can pop up into the gap, it has room to move up toward the $45 level.
Bears want to see bearish volume drop Virgin Galactic down under the flag formation and for it to lose support of the eight-day EMA. If the stock trades below $32.82, it could revisit its next support down near the $27.80 mark.
SPCE Price Action:Virgin Galactic closed up 4% at $36.49.

Comments