KEY POINTS
- Earnings: $4.50 per share, vs. $3.10 per share expected by analysts polled by Refinitiv.
- Revenue: $33.12 billion, vs. $30.52 billion expected.
(April 14) JPMorgan Chasereported first-quarter earnings before the opening bell on Wednesday.
Here are the numbers:
- Earnings:$4.50 per share, vs. $3.10 per share expected by analysts polled by Refinitiv.
- Revenue:$33.12 billion, vs. $30.52 billion expected.
- Credit costs net benefit of $4.2 billion included $5.2 billion of net reserve releases and $1.1 billion of net charge-offs.
- Average loans up 1%; average deposits up 36%
- $1.5 trillion of liquidity sources, including HQLA and unencumbered marketable securities
- Average deposits up 32%; client investment assets up 44%
- Average loans down 7%; debit and credit card sales volume up 9%
- Active mobile customers up 9%
- Global Investment Banking wallet share of 9.0% in 1Q21
- Total Markets revenue of $9.1 billion, up 25%, with Fixed Income Markets up 15% and Equity Markets up 47%
- Gross Investment Banking revenue of $1.1 billion, up 65%
- Average loans down 2%; average deposits up 54%
- Assets under management (AUM) of $2.8 trillion, up 28%
- Average loans up 18%; average deposits up 43%
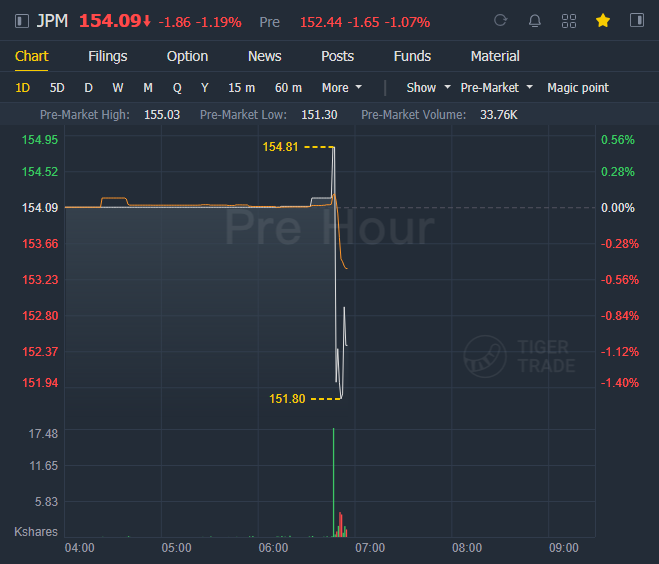
JPMorgan Chase slipped 1% in premarket trading.
JPMorgan Chase, the first major bank to report first-quarter earnings, will be closely watched for clues as to how the industry will emerge from the coronavirus pandemic.
One key question is whether banks will continue to release loan loss reserves — and the magnitude of those releases — that are no longer needed as the U.S. economic recovery gains pace. In the fourth quarter, JPMorgan beat expectations in part by releasing $2.9 billion in reserves.
JPMorgan, with the world's biggest Wall Street division by revenue, is also expected to benefit from robust investment banking fees driven by record issuance of SPACs, the blank check companies that saw more activity in the first quarter than all of 2020, itself a record year. Trading revenue is also expected to be a tailwind in the quarter.
Analysts will also be curious about the pace of share repurchases the bank is expected to make. Last month, the Federal Reserve said banks that pass the industry's 2021 stress test will be allowed to resume higher levels of dividend payouts and buybacks starting June 30.
Shares of JPMorgan rose 21% so far this year, compared to the 25% advance of the KBW Bank Index.

Net income was $14.3 billion, up $11.4 billion, predominantly driven by credit reserve releases of $5.2 billion compared to credit reserve builds of $6.8 billion in the prior year.
Net revenue of $33.1 billion was up 14%. Noninterest revenue was $20.1 billion, up 39%, driven by higher CIB Markets revenue, higher Investment Banking fees, and the absence of losses in Credit Adjustments and Other and markdowns on held-for-sale positions in the bridge book13 recorded in the prior year. Net interest income was $13.0 billion, down 11%, predominantly driven by the impact of lower rates, partially offset by balance sheet growth.
Noninterest expense was $18.7 billion, up 12%, predominantly driven by higher volume- and revenue-related expense and continued investments. The increase in expense also included a $550 million contribution to the Firm’s Foundation.
The provision for credit losses was a net benefit of $4.2 billion driven by net reserve releases of $5.2 billion, compared to an expense of $8.3 billion in the prior year predominantly driven by net reserve builds of $6.8 billion. The Consumer reserve release was $4.5 billion, and included a $3.5 billion release in Card, reflecting improvements in the macroeconomic scenarios, and a $625 million reserve release in Home Lending primarily due to improvements in house price index (HPI) expectations and to a lesser extent portfolio run-off. The Wholesale reserve release was $716 million reflecting improvements in the macroeconomic scenarios. Net charge-offs of $1.1 billion were down $412 million, predominantly driven by Card.

Net income was $6.7 billion, up $6.5 billion, driven by credit reserve releases compared to reserve builds in the prior year. Net revenue was $12.5 billion, down 6%.
Consumer & Business Banking net revenue was $5.6 billion, down 10%, driven by the impact of deposit margin compression, largely offset by growth in deposit balances. Home Lending net revenue was $1.5 billion, up 26%, driven by higher production revenue, partially offset by lower net interest income on lower balances. Card & Auto net revenue was $5.4 billion, down 7%, driven by lower Card net interest income on lower balances, partially offset by lower Card acquisition costs and higher Card net interchange income.
Noninterest expense was $7.2 billion, down 1%.
The provision for credit losses was a net benefit of $3.6 billion, including a $4.6 billion reserve release reflecting improvements in the macroeconomic scenarios compared to a $4.5 billion reserve build in the prior year. Net charge-offs were $1.0 billion, down $290 million, driven by Card.

Comments