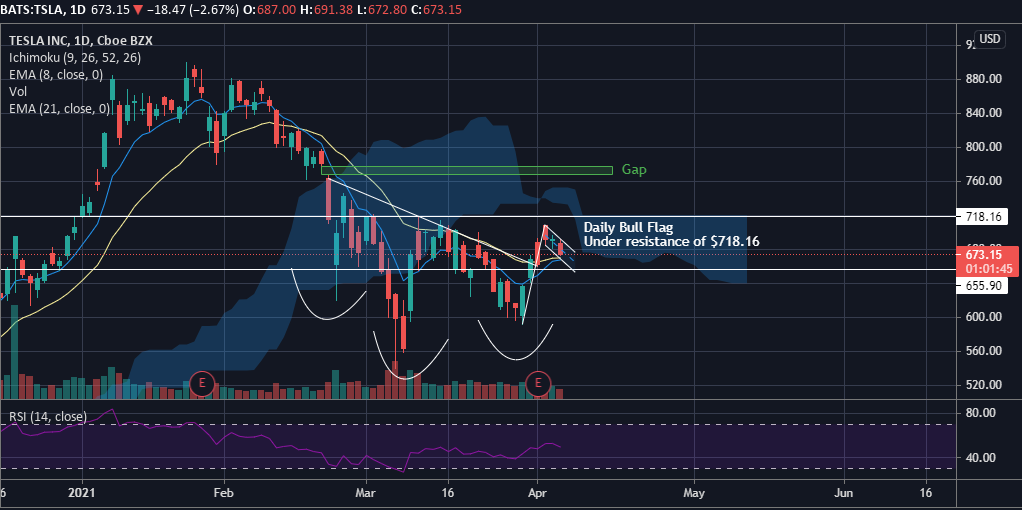
Tesla Inc’s (NASDAQ: TSLA) stock has so far failed to make a significant move back to an all-time high like some of its Nasdaq 100 counterparts. That could change: Tesla’s stock has set up two bullish patterns under a resistance level.
The Tesla Chart: On Monday, Tesla’s stock completed the right shoulder of a bullish inverted head-and-shoulders pattern, reaching $708.16 — exactly $10 below its next resistance level of $718.16.
The stock is trading above both the eight- and 21-day exponential moving averages, and it appears the eight-day EMA is about to cross back above the 21-day EMA, which is bullish.
On Wednesday, Tesla completed its sixth daily candle in a bull flag pattern, with the first three candles in the pattern creating the pole and the last three candles creating the flag.
Since there is a retracement in a bull flag pattern, traders and investors may be looking to buy the dip at the bottom of the flag before Tesla’s stock reacts to the pattern and makes a bullish move higher.
Tesla’s stock could then stall temporarily under resistance at around $718 before jumping above it and continuing on an upward trajectory.
If Tesla’s stock can trade above the resistance at $718, it has room to move up to fill the gap between $768.50 and $777.37.
The flag formation is a descending channel where the stock price retraces slowly and not by more than 50% the length of the pole. The flag formation is considered to be consolidation before the next leg up.
TSLA Price Action: Tesla shares were down 3.09% at $670.26 ahead of the close Wednesday.

Comments