This bear has claws.
A bear market that began on the first trading day of 2022 drove down the S&P 500 for its worst first six months to a calendar year in 52 years as investors head into the second half fearing aggressive monetary tightening by the Federal Reserve and other major central banks could tip the economy into recession.
The S&P 500 fell 20.6% year-to-date through Thursday's close, marking its biggest first-half decline since a 21.1% fall in 1970, according to Dow Jones Market Data. The large-cap benchmark is down 21.1% from its record finish on Jan. 3. The index earlier this month first ended more than 20% below that early January record, confirming that the pandemic bull market -- as widely defined -- had ended on Jan. 3, marking the start of a bear.
The S&P 500 has bounced around 3.2% off its 2022 low close of 3,666.77 set on June 16.
Read:These 10 stocks in the S&P 500 have lost $4.1 trillion of investors' money during the first half of 2022
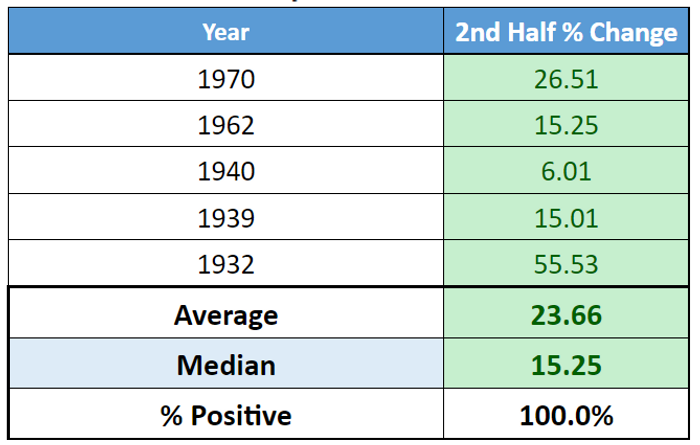
Data compiled by Dow Jones Market Data shows that the S&P 500 has bounced back after past first-half falls of 15% or more. The sample size, however, is small, with only five instances going back to 1932 (see table below).

Investors, however, may also want to pay attention to metrics around bear markets, particularly with the will-it-or-won't-it speculation around whether the Federal Reserve's aggressive tightening agenda will sink the economy into recession.
Indeed, an analysis by Wells Fargo Investment Institute found that recessions accompanied by a recession, on average, lasted 20 months and produced a negative 37.8% return. Bear markets outside a recession lasted 6 months on average -- nearly the length of the current episode -- and saw an average return of -28.9%. Taken together, the average bear market lasted an average of 16 month and produced a -35.1% return.
See:Presidential election cycle shows that stock market may bottom in the third quarter before rally in the fourth, analyst says
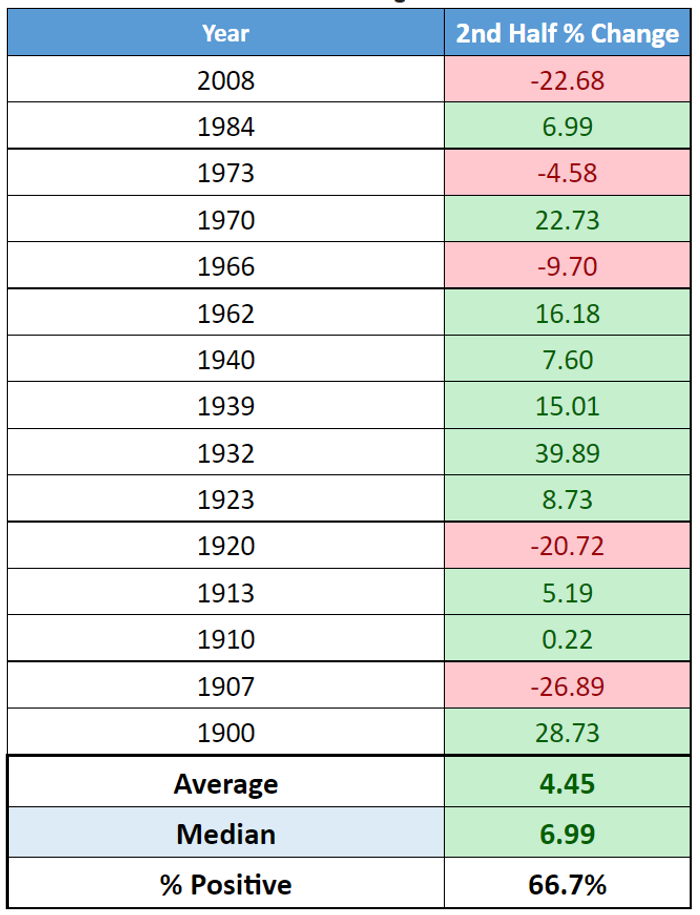
Other major indexes are also set to log historic first-half declines. The Dow Jones Industrial Average fell 15.3% through Thursday, its worst first half since a 23.2% drop in 1962.
As the table below shows, the second-half performance for the blue-chip gauge after first-half declines of 10% or more are variable. The most recent incident, in 2008 during the worst of the financial crisis, saw the Dow drop another 22.68% in the second half of the year.

The tech-heavy Nasdaq Composite dropped more than 29% for the first half, its largest such drop on record. There was little to go on when Dow Jones Market Data looked back at first-half drops of at least 20% for the gauge.
There were only two instances -- 2002 and 1973 -- and both saw the Nasdaq keep sliding over the remainder of the year, falling around 8.7% over the second half in both instances.
Comments