TAL Education Q3 Adj EPS $(0.04) Misses $0.02 Estimate, Sales $232.70M Miss $239.83M Estimate.
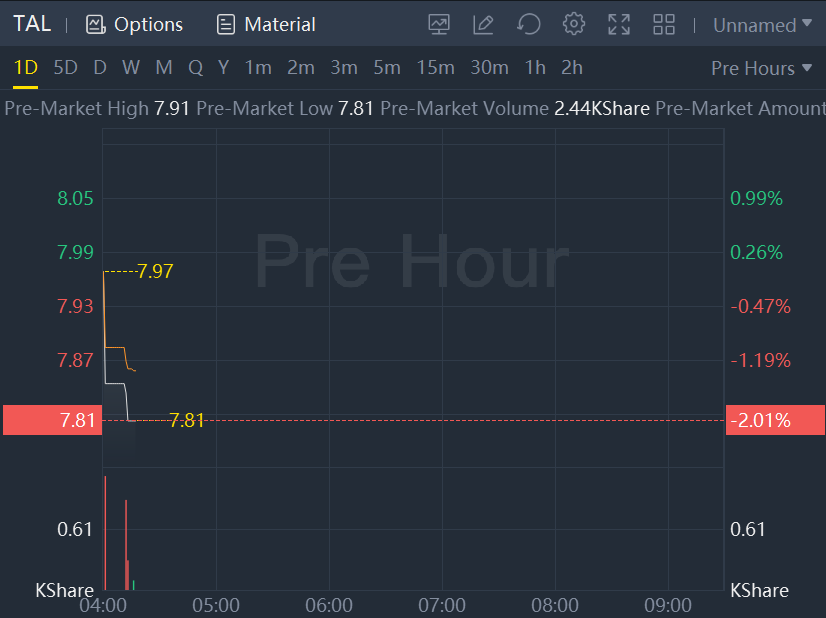
TAL Education shares dropped 2% in premarket trading.
TAL Education Group(NYSE: TAL) , a smart learning solutions provider in China, today announced its unaudited financial results for the third quarter of fiscal year 2023 endedNovember 30, 2022.
Highlights for the Third Quarter of Fiscal Year 2023
- Net revenues was US$232.7 million, compared to net revenues of US$1,020.9 millionin the same period of the prior year.
- Loss from operations was US$32.9 million, compared to loss from operations of US$108.4 millionin the same period of the prior year.
- Non-GAAP loss from operations, which excluded share-based compensation expenses, was US$4.5 million, compared to non-GAAP loss from operations of US$67.6 millionin the same period of the prior year.
- Net loss attributable to TAL was US$51.6 million, compared to net loss attributable to TAL of US$99.4 millionin the same period of the prior year.
- Non-GAAP net loss attributable to TAL, which excluded share-based compensation expenses, was US$23.2 million, compared to non-GAAP net loss attributable to TAL of US$58.6 millionin the same period of the prior year.
- Basic and diluted net loss per American Depositary Share ("ADS") were both US$0.08. Non-GAAP basic and diluted net loss per ADS, which excluded share-based compensation expenses, were both US$0.04. Three ADSs represent one Class A common share.
- Cash, cash equivalents and short-term investments totaled US$3,040.5 millionas ofNovember 30, 2022, compared to US$2,708.7 millionas ofFebruary 28, 2022.
Highlights for the Nine Months EndedNovember 30, 2022
- Net revenues was US$750.8 million, compared to net revenues of US$3,849.8 millionin the same period of the prior year.
- Loss from operations was US$46.3 million, compared to loss from operations of US$615.2 millionin the same period of the prior year.
- Non-GAAP income from operations, which excluded share-based compensation expenses, was US$35.9 million, compared to non-GAAP loss from operations of US$440.5 millionin the same period of the prior year.
- Net loss attributable to TAL wasUS$96.2 million, compared to net loss attributable to TAL ofUS$1,028.0 millionin the same period of the prior year.
- Non-GAAP net loss attributable to TAL, which excluded share-based compensation expenses, was US$14.0 million, compared to non-GAAP net loss attributable to TAL of US$853.3 millionin the same period of the prior year.
- Basic and diluted net loss per ADS were both US$0.15. Non-GAAP basic and diluted net loss per ADS, excluding share-based compensation expenses, were both US$0.02.
Comments