Theater operator's stock tops long-term downtrend line that started at the meme peak of June 2021
Shares of AMC Entertainment Holdings Inc. rallied again Wednesday, extending a recent sharp bounce that appears to have put the stock on track to break out from a long-term technical downtrend.
The movie-theater operator's $(AMC)$ stock, which was one of the original "meme" stocks, shot up as much as 11.3% intraday before pulling back to be up 3.5% in afternoon trading. That followed a 16.4% surge on Tuesday, which bucked the broader stock market's worst day of 2023, even though AMC didn't release any news.
And after running up 20.6% in two days and 40.4% in five days, Wednesday's intraday pullback appears to suggest that upward momentum may be waning, especially since the stock couldn't quite make it up to test a couple of key technical levels on the shorter-term charts.
For one, a downtrend line starting at the Sept. 12 close that connects the closing highs in early December and early February currently extends to roughly $6.50, or about 2.8% above current levels.

Trendlines are one of the easiest ways to identify a trend. Keep in mind that while it only takes two points to draw a line, it takes three points on the line to identify a trend. .
Meanwhile, the 200-day moving average, which many chart watchers view as a dividing line between longer-term uptrends and downtrends, extends to $7.54 on Wednesday, according to FactSet data, which is about 19% above current levels.
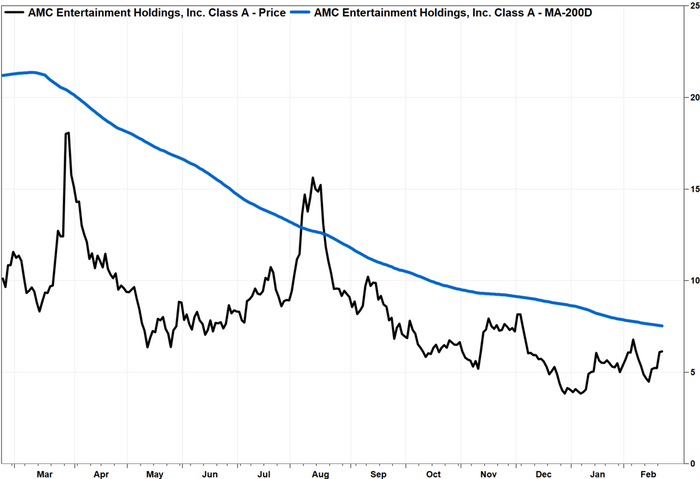
Clearing those levels might seem daunting for bulls, who have already put in a lot of work in the past week. But extending the time frame of AMC's stock chart from a daily chart to a weekly chart, there may be good reason for bulls with a longer-term view to express some enthusiasm.
The stock's rally this week has taken it above a downtrend line that started at the meme-stock weekly closing peak of $36.40 on June 16, 2021, and connected the weekly closes of $15.01 on Aug. 12, 2022, and $6.08 on Feb. 3.
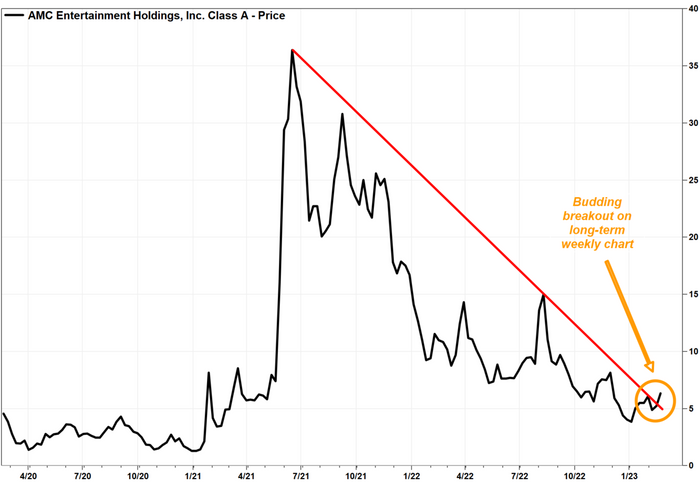
That downtrend line currently extends to just about $5. A close Friday above that line would suggest a breakout has occurred.
One of the six major tenets of the Dow Theory of market analysis, which has remained relevant on Wall Street for more than a century, is that a trend is assumed to remain in effect until there is a definite signal that it has reversed. And trendlines are among the tools that can provide those signals, according to the CMT Association. .
If the breakout signal is confirmed, the 200-day moving average will be a key chart point to keep an eye on, at least for the short term.
AMC shares have soared 55.2% so far in 2023 but have shed 37.6% over the past 12 months, while the S&P 500 has slipped 0.6% this year and has lost 7.6% over the past year.
Comments