Tesla Inc.'s stock has sliced through the bottom of a "triangle" consolidation chart pattern, and investors are worried about further weakness.
But with the electric vehicle giant's stock $(TSLA)$ already suffering its biggest two-day drop in two years following a disappointing earnings report, it has approached an important chart zone with multiple support points, that should at the very least slow the slide, if not stop it.
The recent consolidation pattern in question is referred to as a symmetrical triangle, as a declining trendline defined the top of the pattern and a rising trendline traded out the bottom, with both trendlines following very similar angles toward a future meeting point.
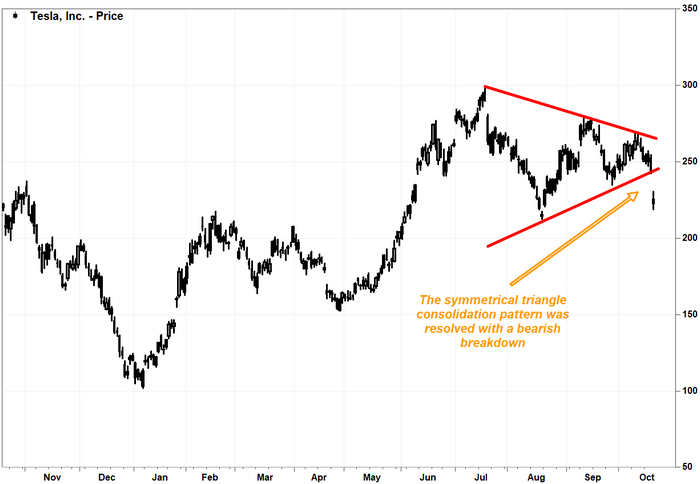
Consolidations shaped as symmetrical triangles are often viewed as continuation patterns, because more often than not they are resolved in the direction of the trend that preceded them. In Tesla's case, the stock has rocketed 91% in 2 1/2 months before it started consolidating, so at first a breakout appeared more likely.
But with the stock opening Thursday well below the bottom of the pattern following the EV maker's rather disappointing earnings report, there was no doubt that Tesla's triangle was resolved with a breakdown.
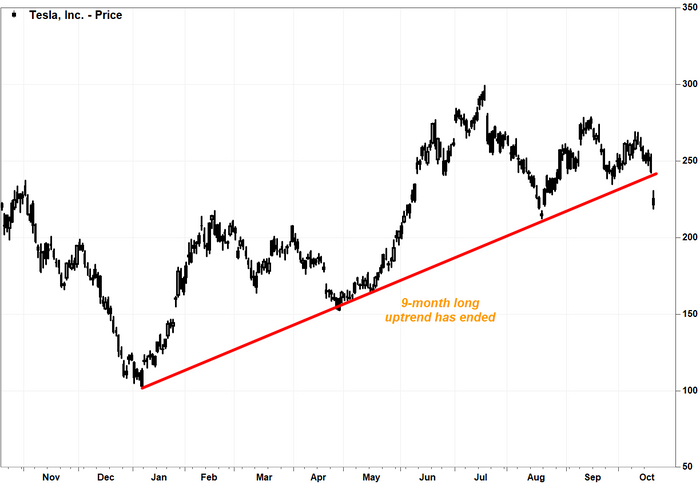
The stock also broke below a rising trendline starting at a 2 1/2-year low hit in January, helping confirm the bearish technical outlook.
But there is a silver lining.
The stock tumbled 10.2% in afternoon trading, and has plunged 14.5% the past two days. That's the biggest two-day decline since it plummeted 16.3% during the two days ended Nov. 9, 2021.
That has brought the stock close to what could be rather strong support, with multiple chart points that could draw out buying interest. Those points include the 200-day moving average and previous peaks and troughs, as Fairlead Strategies LLC technical analyst Katie Stockton noted.
The 200-DMA is viewed by many chart watchers as a dividing line between longer-term uptrends and downtrends. It often acts as a battleground between bulls and bears, providing support on the way down and resistance on the way up.
That line current extends to about $214.18, according to FactSet data.
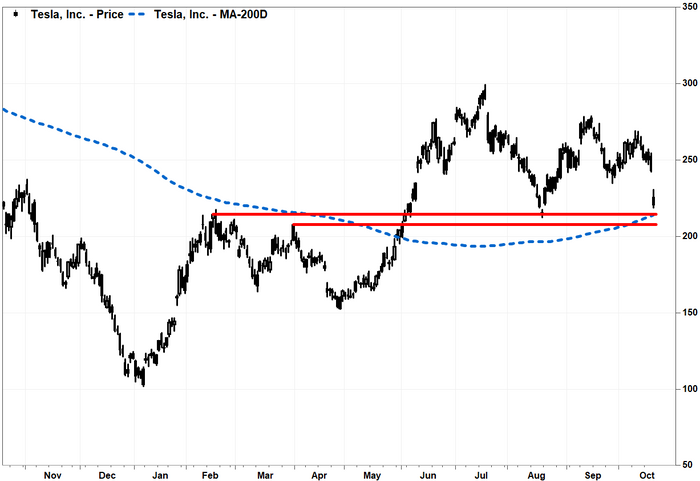
Based on a technical concept referred to by candlestick charting guru Steve Nison as "change in polarity," the February highs just above $214 and the late-March high at roughly $208 could attract buying interest. Read more about "change of polarity."
The idea is, those that who sold shares aggressively enough at those levels to stop rallies, then watched them shoot above those levels just a couple of months later, might be very happy to buy back those shares at breakeven.
The fact that the August low was within the range of previous highs confirms that the concept applies to Tesla's stock.
If that support zone breaks, the next downside target area is determined by a "measured move" calculation, in which the height of the broken triangle is subtracted from the point of the breakdown.
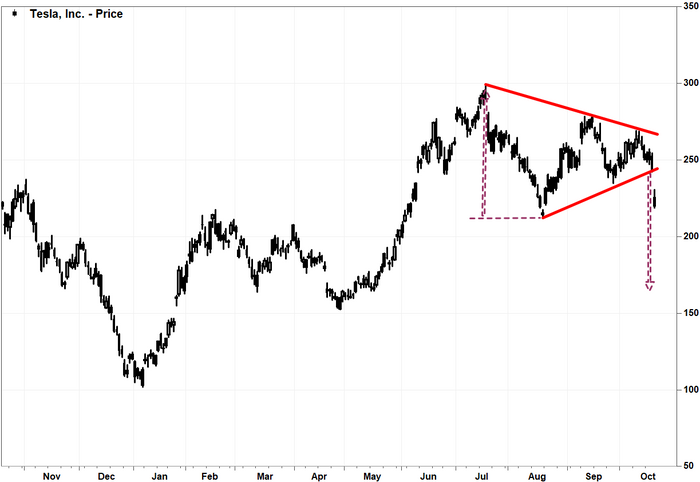
Since the height of the triangle is roughly $78 on a closing basis, and the breakdown point was roughly $243, the downside target becomes $165.
That would be right around the May lows.
But before the support zone is tested, breakdowns like the one suffered Thursday are often followed by bounces back to the breakdown point, as bulls test the bears' resolve. That's when bears who missed out on selling on the break, given that the stock opened well below that level, tend to rush to sell.
How the stock behaves over the next couple of sessions may provide a clue to how the stock will behave at the support zone.
Comments