Visa Inc (NYSE:V), will be reporting its second-quarter earnings on Tuesday. Wall Street expects $2.44 in EPS and $8.62 billion in revenues as the company reports after market hours.
The company has been delivering an earnings beat over the last four quarters. The stock experienced significant gains from October 2023 to March 2024. However, it has fallen more than 7% since March 21, which has reduced its year-to-date performance to just 3.62%.
The stock appears to have been impacted by:
- $Capital One Financial Corp(COF-N)$ (NYSE:COF) ongoing acquisition of Discover Financial Services (NYSE:DFS) for $35.3 billion, with the goal is to challenge the dominance of Visa and Mastercard.
- The settlement of the class action suit against Visa and Mastercard Inc (NYSE:MA), which resulted in both companies agreeing to reduce swipe fees for merchants by at least four basis points for three years. Additionally, they agreed to not increase swipe fees above the rates set as of December 31, 2023, for five years.
Consequently, Mastercard, Visa’s rival and peer, has also witnessed its stock slide by 6.80% since March 21. Mastercard is set to report its Q1 earnings on May 1, before the market open.
Also Read: Understanding Visa’s Position In Financial Services Industry Compared To Competitors
Let’s look at the technical setup of the stock, as the company heads into reporting Q2 earnings.
Visa Stock Technical Setup Ahead Of Q2 Earnings
Visa’s stock is currently experiencing a strongly bearish trend as it sits below its 5, 20, and 50-day simple moving averages, indicating slight selling pressure.
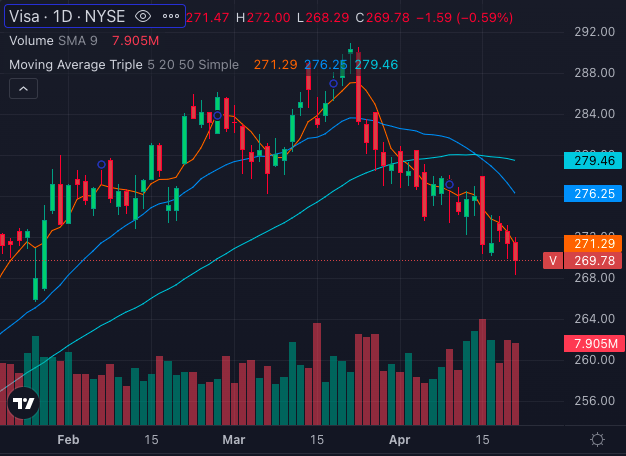
Chart: Benzinga Pro
With a share price of $269.78, below the 8-day simple moving average of $271.29, 20-day SMA of $276.25, and 50-day SMA of $279.46, the technical signals point towards a bearish sentiment.
However, the stock’s price exceeding the 200-day simple moving average of $255.79 provides a bullish indication.

Chart: Benzinga Pro
The Moving Average Convergence Divergence (MACD) indicator stands at -2.54, reinforcing the bearish sentiment, while the Relative Strength Index (RSI) of 34.6 sees the stock nearing oversold conditions (<30).
The Bollinger Bands also echo the bearish sentiment, with the price trading in the lower band since March 21.
Visa Analysts Consensus Ratings
Ratings & Consensus Estimates: The consensus analyst rating on Visa stock over the past 100 ratings stands at Outperform with a price target of $265.77.
However, the last three ratings on the stock from analysts who reviewed the stock on or after March 27, have an average price target of $301.67 between Baird, TD Cowen, and Mizuho. There’s an implied 12.02% upside for Visa stock from these 3 analyst ratings.
Price Action: Visa stock was up 0.04% to $269.89 during early morning trading on Monday.
Read Next: Visa To Rally Around 18%? Here Are 10 Top Analyst Forecasts
Photo: Shutterstock
Comments