
imagedepotpro
Overview
Dividend ETFs can be a great tool to help you remain invested in the market over long stretches of time. This is because they tend to focus on cash flow positive companies that have consistently grown earnings and maintained a healthy payout ratio. The emphasis on these factors can sometimes translate to more stability in price and less volatile reactions to market influences such as earnings season, political catalysts, or interest rates. iShares Core Dividend Growth ETF (NYSEARCA:DGRO) offers investors a way to obtain low cost exposure to a diverse range of dividend paying companies.
There are a ton of different dividend ETFs out there, and I frequently see many people debate on which is the 'best'. However, I strongly believe that the 'best' is typically a subjective matter, and it ultimately comes down to what your individual goals are with an investment. Dividend ETFs can be crafted in a multitude of ways; some focusing on dividend growth, while others look to provide the highest total return possible. There are even some dividend focused ETFs out there with larger than normal yields, which can be appealing to income focused investors.
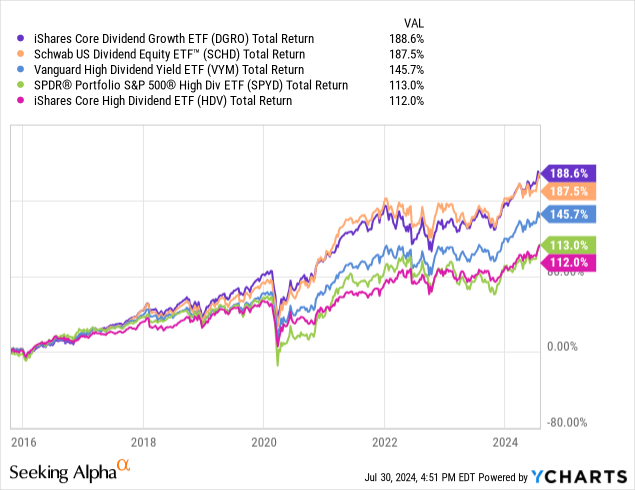
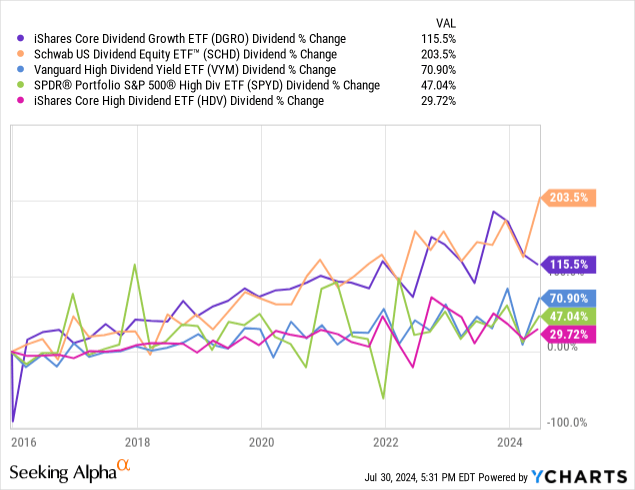
Since DGRO sports a mild dividend yield of 2.2%, it isn't the most attractive from an income perspective. This idea is further reinforced when looking at the dividend growth rate compared to some popular peer ETFs. However, I believe there is still plenty of value with a position in DGRO and this is evident by measuring the total return profile when compared against some of these same peers. We can see that DGRO has provided investors with the highest total return of over 188% over the last near decade. DGRO outperforms popular peers such as:
- Schwab U.S. Dividend Equity ETF (SCHD)
- Vanguard High Dividend Yield ETF (VYM)
- SPDR Portfolio S&P 500 High Dividend ETF (SPYD)
- iShares Core High Dividend ETF (HDV)
Once again, the idea of what makes a dividend ETF 'the best' is completely different for each individual based on their investing objective. Remaining as unbiased as possible, I aim to provide a fair evaluation of DGRO and provide some insights on why it has outperformed against some of these peers and why I believe it may continue to outperform. Let's first start by taking a look at the holdings within.
Strategy & Holdings
A part of DGRO's strategy is to provide exposure to companies that have a history of consistently growing their dividend. The fund has a very attractive expense ratio of only 0.08% and is managed by BlackRock Fund Advisors. The ETF launched in 2014 so we have slightly over a decade of performance to reference. What I like about DGRO is that it manages to find a mixed balance between exposure to both growth and value companies within. This provides an investment that has returns comprised of both income and capital appreciation.
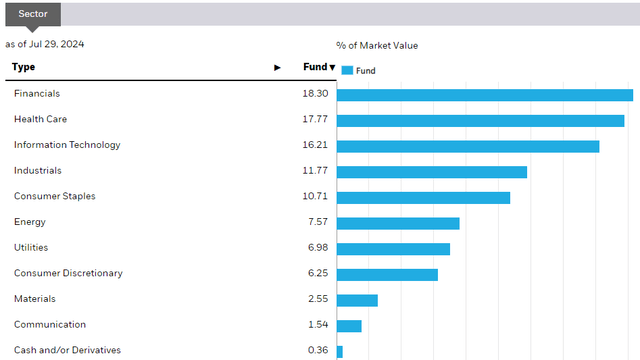
Since this is a dividend ETF, DGRO maintains exposure to sectors that are known for their consistent dividend growth rates and predictable cash flows. Financials currently have the largest weight, accounting for 18.3% of the market value. This is followed by exposure to the health care sector, making up 17.7%. DGRO also provides exposure to all of the other expected sectors like Consumers, Utilities, Industrials, and Energy. However, I am impressed that the fund can maintain a large exposure to the tech sector, sitting at 16.21%. Technology companies aren't typically known for their consistent dividend growth rates, so I notice that a lot of peer dividend ETFs lack any meaningful technology exposure.
iShares
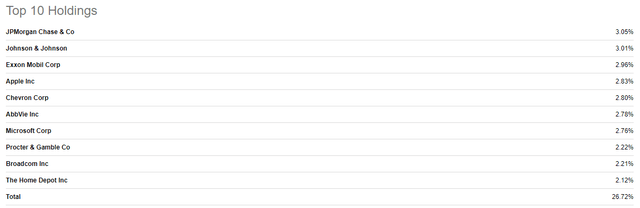
Another aspect of DGRO that I like is that the fund is more plentiful in the amount of holdings that it provides investors. According to the most recent Fact Sheet, there are approximately 412 individual holdings within DGRO. The top holding is JPMorgan (JPM), making up 3.05% of the fund. This is closely followed by Johnson & Johnson (JNJ) as well as Exxon Mobil (XOM), making up 3.01% and 2.96% respectively. In the fourth spot is where we see the technology exposure, consisting of a 2.83% weight in Apple (AAPL).
Seeking Alpha
While I do like the fact that the ETF provides exposure to many high quality names, this also presents a bit of a weakness. Since there are so many holdings within, none of the holding weights surpass the 3% mark. While this helps from a risk mitigation standpoint, it may also dampen the impact of price gains during a bull market.
Performance Comparison
We've already established that DGRO has outperformed the peer group in total return. A lot of this outperformance can be attributed to the fact that DGRO maintains the highest exposure to the technology sector. The tech sector is well known for containing 'growthier' companies with earnings that grow more rapidly. As a result, these technology companies are usually excluded from having a meaningful weight in dividend ETFs. As a reminder, DGRO maintains a tech weight of 16.21%. Just for reference, here are each of the tech weightings for these peer ETFs:
- SCHD: 8.55%
- VYM: 12.77%
- SPYD: 1.58%
- HDV: 3.51%
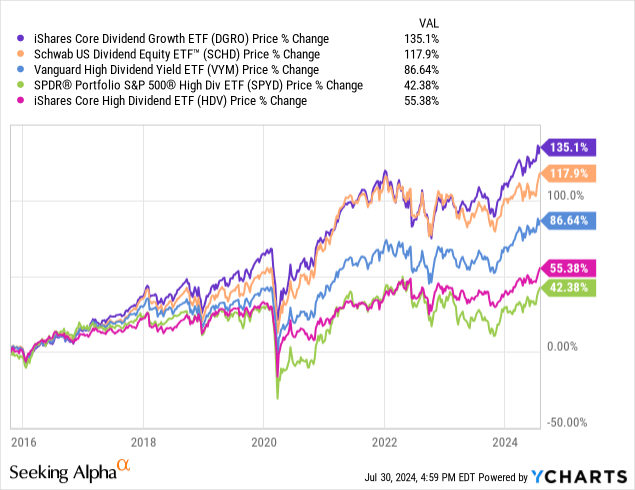
Comparing the price returns of each fund below, we can see how this has an effect on growth. We can see that the dividend ETFs with a higher inclusion of tech tend to capture a greater level of price growth. With this in mind, I strongly believe that whoever has the largest tech exposure has larger possibility of outperformance. One of the catalysts to the sector would be the growing demand for AI tools. As such, AI is estimated to drive a 160% growth in data center demand by 2030.
Where DGRO isn't outperforming would be the level of dividend growth it has provided. We can see that SCHD has provided a higher level of dividend growth over the decade, amounting to a total growth of 203%. DGRO falls a bit short of this, with growth totaling 115% over the same time period. However, DGRO still significantly outpaces the peer group here and provides a meaningful level of dividend growth.
Once again, it ultimately comes down to your preference. Perhaps you don't necessarily care for the absolute highest dividend growth rate and would only like to capture the highest total return possible, while remaining exposed to dividend paying companies. There can always be an argument made that the highest total return is preferable, since an investor can always sell out of their position and repurpose those funds into higher yielding asset classes anyways. I think it's all highly situational, and you should consider what it is you are seeking with these types of ETFs. In addition, just because DGRO doesn't offer the absolute highest level of dividend growth doesn't mean it still can't be a great fund for growing your dividend income over time.
Dividend
As of the latest declared quarterly dividend of $0.2932 per share, the current dividend yield sits at 2.27%. While offering the lowest yield of the peer group, DGRO still has plenty of potential to provide a growing stream of dividend income since the growth rate remains solid. For reference, here are the current dividend yield for each of the mentioned peers:
- SCHD: 3.42%
- VYM: 2.89%
- SPYD: 4.24%
- HDV: 3.32%
DGRO has increased the dividend for nine consecutive years in a row, adding to its credibility as a reliable income producer. In addition, the dividend has increased at a CAGR (compound annual growth rate) of 9.30% over the last five-year period. For reference, this outpaces the median dividend growth rate of 5.36% for ETFs in the same category. To demonstrate how attractive this level of growth is, I ran a back test of an initial investment of $10,000 at the start of 2015. This graph assumes that you also contributed a fixed amount of $500 every month to your position, as well as reinvested all dividends back into DGRO.

Portfolio Visualizer
In year 1 of your investment, your annual dividend income would have only amounted to $326. Fast forward to the full year of 2023, your dividend income would now amount to $2,890. This represents a growth in income of nearly 9x from your original total in year 1. The best part about this income is that the dividends are classified as qualified, which means that they receive the most favorable tax treatment.
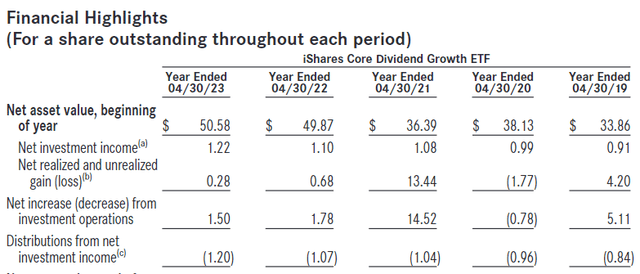
Taking a look at the most recent prospectus report also provides additional detail on how the dividend is supported. We can see that for the last five years the net investment income has supported the distribution fully. The fund is able to retain the net realized gains from internal buying and selling, and this is what helps the price move upward over time. As long as net investment income can continue to fully support the distribution without the assistance of net realized gains, DGRO should continue to provide capital appreciation during bull markets.
DGRO 2023 Prospectus
Vulnerabilities
Since the dividend growth rate may not be as strong as SCHD's, the level of income received may not grow to a sufficient level. For instance, if you are an investor that is ten years away from retirement, and you are actively trying to shift your portfolio to focus more on income, DGRO may not be the best choice. Additionally, since the starting dividend yield is so much lower than peers, it would require a larger initial investment to get a sizeable stream of dividend income every year.
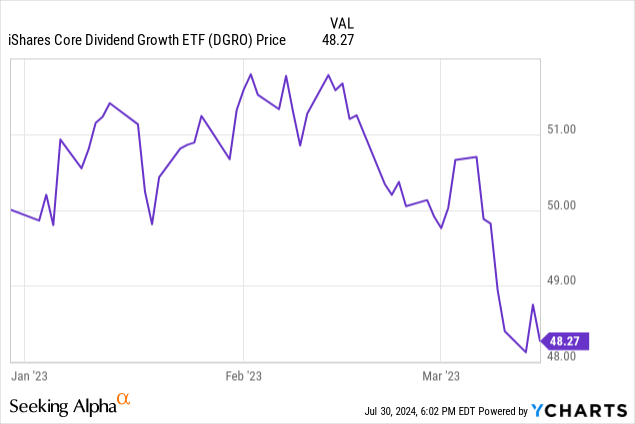
Additionally, financials make up the largest weight here and this could present come concentration risk to the sector. In fact, we've already seen some weakness here, last year in 2023. When Silicon Valley Bank collapsed on March 10th of 2023, DGRO's price was impacted to the downside. While the price quickly recovered, we can see in the chart below how the price reacted. I've filtered the chart to show the price change from Jan 1st, 2023 to March 20th, 2023. Therefore, we can see a similar story happen in the future if the sector gets hit with another unforeseen event.
Lastly, the fund does provide a wide array of exposure with over 400 different holdings within. While this adds a nice layer of diversity, I feel that it can also leave the fund a bit unfocused. Since there are so many different holdings within DGRO, the fund likely exposes shareholders to some lackluster holdings that likely do not a long track record of dividend or earnings growth. For example, I recently published an analysis on First Trust Rising Dividend Achievers ETF (RDVY) where I discussed how the fund's strategy had a specific criteria list that a company must achieve before becoming eligible to become part of the ETF.
RDVY requires holdings to have grown dividends for at least 5 years while maintaining a payout ratio less than 65%. RDVY also requires holdings to have earnings that sit higher than they were reported three years prior. This system ensures that RDVY only includes the highest of quality holdings. I have not been able to locate any sort of specific criteria like this within DGRO's prospectus. If DGRO were to include a similar strategy, they could trim a lot of the extra fat within and only focus on the highest quality companies.
Takeaway
In conclusion, DGRO is a great choice for investors looking to capture the highest total return from exposure to dividend paying companies. The ETF offers instant diversification across all sectors and even has manages to maintain a sizeable technology exposure. This tech exposure has helped DGRO achieve a higher total return over the last decade when compared against some peers like SCHD, VYM, SPYD, or HDV. The fund has also managed to grow the dividend at a sufficient rate that can compound your dividend income over time. While there may be some vulnerabilities with the heavy financial sector exposure and large amount of holdings, DGRO's performance has remained strong. Therefore, I believe that DGRO is a great fund to hold for the long term.
Comments