
Dmytro Lastovych/iStock via Getty Images
SRET strategy
Global X SuperDividend® REIT ETF (NASDAQ:SRET) is a high-yield ETF launched on 03/16/2015 and tracking the Solactive Global SuperDividend® REIT Index. It has a portfolio of 30 REITs (Real Estate Investment Trusts), a 30-day SEC yield of 8.14% and a total expense ratio of 0.59%. Distributions are paid on a monthly basis.
As described in the prospectus by Global X, "The Underlying Index tracks the performance of REITs that rank among the highest yielding REITs globally." Securities with the highest historical volatility are excluded. The fund holds REITs, as well as ADRs (American Depositary Receipts) and GDRs (Global Depositary Receipts) based on constituents of the underlying index. The portfolio turnover rate in the most recent fiscal year was 93%.
Portfolio
About 77% of asset value is in U.S.-based REITs. The next chart plots the geographical allocation, excluding the U.S. for readability. Singapore comes in second position with 6.4%. Other countries are in a narrow range between 2.8% and 3.6%.
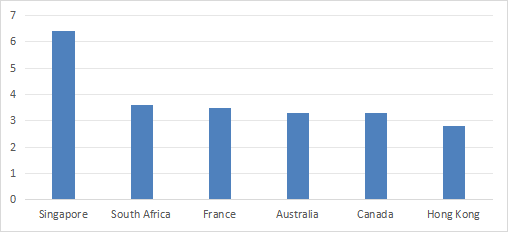
Ex-US geographical allocation in % of assets (Chart: author, data: Global X)
Over 37% of asset value is in mortgage REITs, which are debt-based business entities classified by GICS in the financial sector (not in real estate). Healthcare REITs (about 20%) and diversified REITs (about 19%) are the heaviest equity REIT industries in the portfolio. Other industries are below 10%.
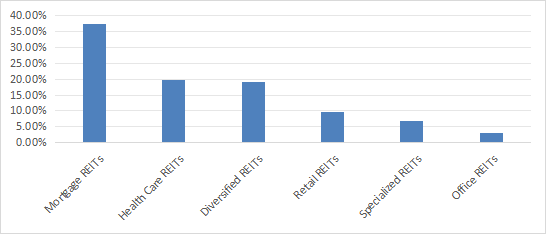
Industry breakdown (Chart: author, data: Fidelity)
The top 10 holdings, listed in the next table, represent 38.4% of asset value and weigh between 3.5% and 4.8%. Therefore, the portfolio is quite concentrated, but risks related to individual trusts are moderate.
Ticker | Name | Weight% |
NHI | 4.78 | |
OHI | 4.43 | |
SBRA | Sabra Health Care REIT, Inc. | 4.04 |
MFA | 3.67 | |
COV FP | COVIVIO | 3.66 |
LTC | LTC Properties, Inc. | 3.64 |
GTY | 3.59 | |
GLPI | Gaming and Leisure Properties, Inc. | 3.54 |
GRT SJ | GROWTHPOINT PROP | 3.53 |
EFC | $Ellington Financial Inc.(EFC-B)$ | 3.48 |
Performance
The next chart compares total returns since inception of SRET with an equity REIT benchmark and a mortgage REIT benchmark:
- Vanguard Real Estate Index Fund ETF Shares (VNQ).
- iShares Mortgage Real Estate Capped ETF (REM).
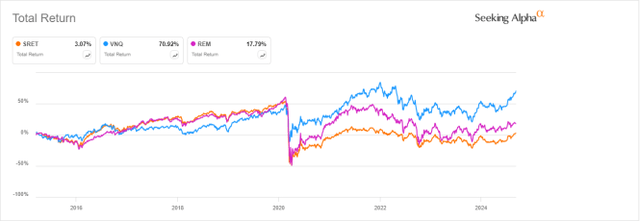
SRET vs VNQ, REM total return since 3/17/2015 (Seeking Alpha)
SRET has underperformed both benchmarks by a significant margin, making it quite unattractive. However, it is ahead of the mortgage REIT fund over the last 12 months:
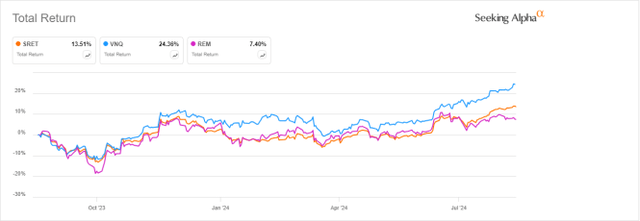
SRET vs VNQ, REM 12-month total return (Seeking Alpha)
Excluding distributions, both SRET and REM have lost about half of their value since SRET's inception, as reported on the next chart. It represents a considerable loss of capital for shareholders, amplified by cumulative inflation: about 33% at the same time, based on CPI. We would expect that the equity part of SRET may provide anf excess return or reduced risk over a full-mortgage REIT benchmark. Historical data shows it's not the case.
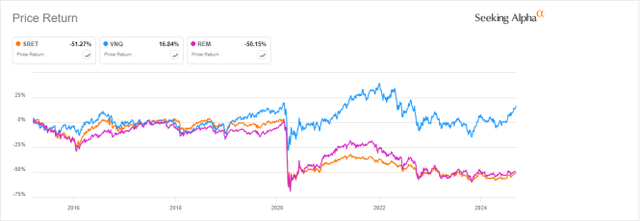
SRET vs VNQ, REM price return since 3/17/2015 (Seeking Alpha)
Distribution history looks even worse. The annual sum of distributions went down from $3.48 per share in 2016 to $1.60 in 2023. For shareholders, this is a 54% loss of income stream in just 7 years, while the cumulative inflation was about 30%.
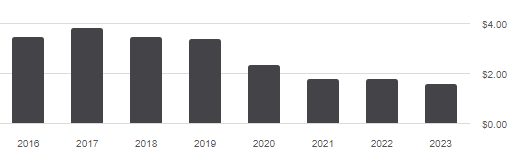
SRET distribution history (Seeking Alpha)
SRET vs. competitors
The next table compares the characteristics of SRET and the four largest global REIT ETFs:
- iShares Global REIT ETF (REET).
- Vanguard Global ex-U.S. Real Estate Index Fund ETF Shares (VNQI).
- SPDR® Dow Jones® Global Real Estate ETF (RWO).
- Xtrackers International Real Estate ETF (HAUZ).
SRET | REET | VNQI | RWO | HAUZ | |
Inception | 3/16/2015 | 7/8/2014 | 11/1/2010 | 5/7/2008 | 10/1/2013 |
Expense Ratio | 0.59% | 0.14% | 0.12% | 0.50% | 0.10% |
AUM | $225.39M | $4.10B | $3.94B | $1.34B | $764.34M |
Number of Holdings | 31 | 370 | 721 | 253 | 430 |
Turnover | 92.84% | 6.00% | 5.00% | 5.00% | 15.00% |
Dividend Yield (TTM) | 7.41% | 2.68% | 3.55% | 3.23% | 3.54% |
SRET has the highest yield, but also the highest expense ratio of these funds. It is the least diversified and has the highest turnover. The chart below plots total returns since SRET's inception. SRET was the best performer before the 2020 market meltdown, but it is now the worst one.
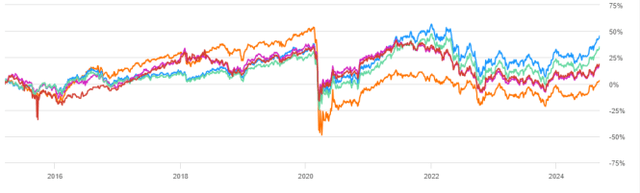
SRET vs. Competitors (Seeking Alpha)
It also lags the competition over the last 12 months:
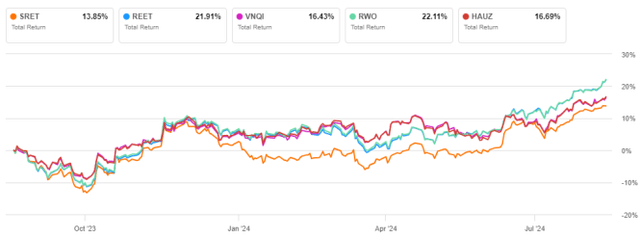
SRET vs. Competitors, last 12 months (Seeking Alpha)
Takeaway
Global X SuperDividend® REIT ETF has a portfolio of 30 high-yield REITs. It claims a global exposure, but U.S. issuers represent over 3/4 of asset value, with over one-third in mortgage REITs. Looking at historical data is like watching a train wreck in slow motion. SRET has lost more than 50% since 2015 regarding both value and distribution. It has lagged U.S. REIT benchmarks (both equity and mortgage) and the largest global REIT ETFs. Therefore, I give SRET a "Sell" rating, although it may be profitable as a swing trading instrument for seasoned investors buying and selling at the right time.
Comments