Delta Air Lines Inc (NYSE:DAL) will be reporting its fourth-quarter earnings on Friday. Wall Street expects $1.76 in EPS and $14.21 billion in revenues as the company reports before market hours.
The stock is up 45.13% over the past year, 30.99% over the past six months.
Let’s look at what the charts indicate for Delta Air Lines stock and how the stock currently maps against Wall Street estimates.
Read Also: BoFA Expects DeltaTo Maintain 10% EPS Growth in 2025, Sees Strong Q4 Result
Delta Air Lines Stock Strongly Bullish Ahead of Q4 Earnings

Chart created using Benzinga Pro
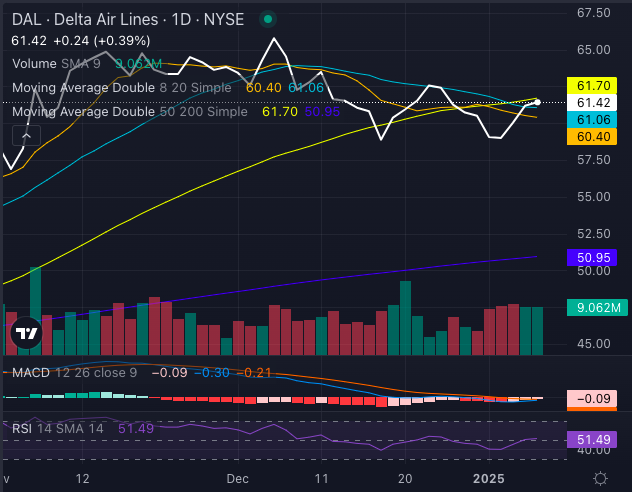
Delta Air Lines stock demonstrates a strongly bullish trend, with the share price positioned above its eight-, 20-, and 200-day simple moving averages (SMAs). This sustained buying pressure highlights positive momentum and potential for further bullish movement.
However, Delta Air Lines stock trades below its 50-day SMA of $61.70, introducing a cautious note to the short-term outlook.
The Moving Average Convergence Divergence (MACD) indicator at a negative 0.30 signals a bearish sentiment, suggesting potential headwinds.
Meanwhile, the Relative Strength Index (RSI) at 51.49 reflects a neutral stance, indicating neither overbought nor oversold conditions, leaving room for directional movement.
Delta Air Lines Analysts Consensus Ratings
Ratings & Consensus Estimates: The consensus analyst rating on Delta Air Lines stock stands currently at Buy with a price target of $66.18. The latest analyst ratings from Susquehanna, Citigroup and UBS imply a 29.39% upside for Delta Air Lines stock, with an average price target of $79.67.
DAL Stock Price Action: Delta Air Lines stock was trading at $61.42 at the time of publication Thursday.
Read Next:
- Wildfire Rips Through LA’s Pacific Palisades Neighborhood Destroying Homes: 3,000 Acres Burned As 30,000 Residents Evacuate
Photo by VanderWolf via Shutterstock
Comments