Bar Pacific Group Holdings Limited's (HKG:8432) price-to-sales (or "P/S") ratio of 0.2x might make it look like a buy right now compared to the Hospitality industry in Hong Kong, where around half of the companies have P/S ratios above 0.7x and even P/S above 3x are quite common. However, the P/S might be low for a reason and it requires further investigation to determine if it's justified.
Check out our latest analysis for Bar Pacific Group Holdings
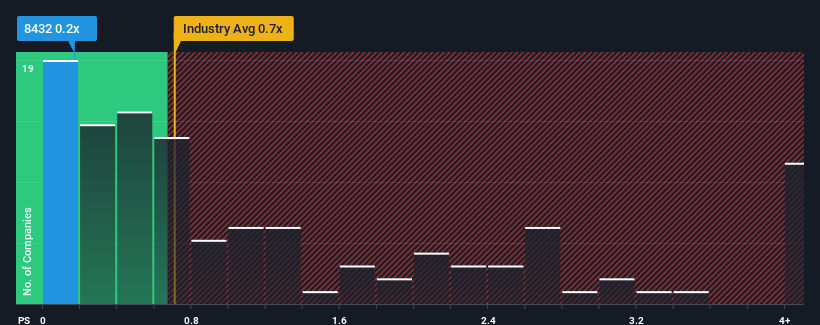
What Does Bar Pacific Group Holdings' P/S Mean For Shareholders?
For instance, Bar Pacific Group Holdings' receding revenue in recent times would have to be some food for thought. Perhaps the market believes the recent revenue performance isn't good enough to keep up the industry, causing the P/S ratio to suffer. However, if this doesn't eventuate then existing shareholders may be feeling optimistic about the future direction of the share price.
Want the full picture on earnings, revenue and cash flow for the company? Then our free report on Bar Pacific Group Holdings will help you shine a light on its historical performance.What Are Revenue Growth Metrics Telling Us About The Low P/S?
Bar Pacific Group Holdings' P/S ratio would be typical for a company that's only expected to deliver limited growth, and importantly, perform worse than the industry.
Retrospectively, the last year delivered a frustrating 7.3% decrease to the company's top line. However, a few very strong years before that means that it was still able to grow revenue by an impressive 202% in total over the last three years. Accordingly, while they would have preferred to keep the run going, shareholders would definitely welcome the medium-term rates of revenue growth.
This is in contrast to the rest of the industry, which is expected to grow by 15% over the next year, materially lower than the company's recent medium-term annualised growth rates.
In light of this, it's peculiar that Bar Pacific Group Holdings' P/S sits below the majority of other companies. It looks like most investors are not convinced the company can maintain its recent growth rates.
The Bottom Line On Bar Pacific Group Holdings' P/S
It's argued the price-to-sales ratio is an inferior measure of value within certain industries, but it can be a powerful business sentiment indicator.
We're very surprised to see Bar Pacific Group Holdings currently trading on a much lower than expected P/S since its recent three-year growth is higher than the wider industry forecast. When we see robust revenue growth that outpaces the industry, we presume that there are notable underlying risks to the company's future performance, which is exerting downward pressure on the P/S ratio. At least price risks look to be very low if recent medium-term revenue trends continue, but investors seem to think future revenue could see a lot of volatility.
You always need to take note of risks, for example - Bar Pacific Group Holdings has 1 warning sign we think you should be aware of.
Of course, profitable companies with a history of great earnings growth are generally safer bets. So you may wish to see this free collection of other companies that have reasonable P/E ratios and have grown earnings strongly.
Valuation is complex, but we're here to simplify it.
Discover if Bar Pacific Group Holdings might be undervalued or overvalued with our detailed analysis, featuring fair value estimates, potential risks, dividends, insider trades, and its financial condition.
Access Free AnalysisHave feedback on this article? Concerned about the content? Get in touch with us directly. Alternatively, email editorial-team (at) simplywallst.com.This article by Simply Wall St is general in nature. We provide commentary based on historical data and analyst forecasts only using an unbiased methodology and our articles are not intended to be financial advice. It does not constitute a recommendation to buy or sell any stock, and does not take account of your objectives, or your financial situation. We aim to bring you long-term focused analysis driven by fundamental data. Note that our analysis may not factor in the latest price-sensitive company announcements or qualitative material. Simply Wall St has no position in any stocks mentioned.
Comments