The Bridger Aerospace Group Holdings, Inc. (NASDAQ:BAER) share price has fared very poorly over the last month, falling by a substantial 28%. The recent drop completes a disastrous twelve months for shareholders, who are sitting on a 61% loss during that time.
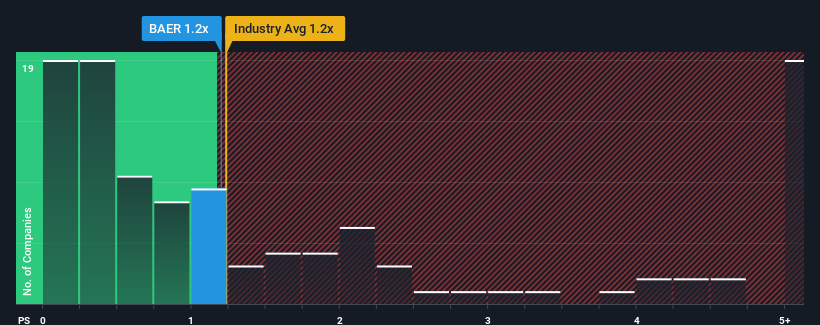
Although its price has dipped substantially, you could still be forgiven for feeling indifferent about Bridger Aerospace Group Holdings' P/S ratio of 1.2x, since the median price-to-sales (or "P/S") ratio for the Commercial Services industry in the United States is about the same. While this might not raise any eyebrows, if the P/S ratio is not justified investors could be missing out on a potential opportunity or ignoring looming disappointment.
Check out our latest analysis for Bridger Aerospace Group Holdings
What Does Bridger Aerospace Group Holdings' P/S Mean For Shareholders?
Bridger Aerospace Group Holdings certainly has been doing a good job lately as it's been growing revenue more than most other companies. It might be that many expect the strong revenue performance to wane, which has kept the P/S ratio from rising. If you like the company, you'd be hoping this isn't the case so that you could potentially pick up some stock while it's not quite in favour.
Want the full picture on analyst estimates for the company? Then our free report on Bridger Aerospace Group Holdings will help you uncover what's on the horizon.How Is Bridger Aerospace Group Holdings' Revenue Growth Trending?
In order to justify its P/S ratio, Bridger Aerospace Group Holdings would need to produce growth that's similar to the industry.
If we review the last year of revenue growth, the company posted a terrific increase of 26%. The strong recent performance means it was also able to grow revenue by 114% in total over the last three years. So we can start by confirming that the company has done a great job of growing revenue over that time.
Turning to the outlook, the next year should generate growth of 40% as estimated by the sole analyst watching the company. Meanwhile, the rest of the industry is forecast to only expand by 8.1%, which is noticeably less attractive.
In light of this, it's curious that Bridger Aerospace Group Holdings' P/S sits in line with the majority of other companies. It may be that most investors aren't convinced the company can achieve future growth expectations.
What Does Bridger Aerospace Group Holdings' P/S Mean For Investors?
Bridger Aerospace Group Holdings' plummeting stock price has brought its P/S back to a similar region as the rest of the industry. Using the price-to-sales ratio alone to determine if you should sell your stock isn't sensible, however it can be a practical guide to the company's future prospects.
We've established that Bridger Aerospace Group Holdings currently trades on a lower than expected P/S since its forecasted revenue growth is higher than the wider industry. There could be some risks that the market is pricing in, which is preventing the P/S ratio from matching the positive outlook. At least the risk of a price drop looks to be subdued, but investors seem to think future revenue could see some volatility.
Plus, you should also learn about these 3 warning signs we've spotted with Bridger Aerospace Group Holdings.
If companies with solid past earnings growth is up your alley, you may wish to see this free collection of other companies with strong earnings growth and low P/E ratios.
Valuation is complex, but we're here to simplify it.
Discover if Bridger Aerospace Group Holdings might be undervalued or overvalued with our detailed analysis, featuring fair value estimates, potential risks, dividends, insider trades, and its financial condition.
Access Free AnalysisHave feedback on this article? Concerned about the content? Get in touch with us directly. Alternatively, email editorial-team (at) simplywallst.com.This article by Simply Wall St is general in nature. We provide commentary based on historical data and analyst forecasts only using an unbiased methodology and our articles are not intended to be financial advice. It does not constitute a recommendation to buy or sell any stock, and does not take account of your objectives, or your financial situation. We aim to bring you long-term focused analysis driven by fundamental data. Note that our analysis may not factor in the latest price-sensitive company announcements or qualitative material. Simply Wall St has no position in any stocks mentioned.
Comments