Tencent Holdings (HKG:700) Full Year 2024 Results
Key Financial Results
- Revenue: CN¥660.3b (up 8.4% from FY 2023).
- Net income: CN¥194.1b (up 68% from FY 2023).
- Profit margin: 29% (up from 19% in FY 2023). The increase in margin was primarily driven by higher revenue.
- EPS: CN¥20.94 (up from CN¥12.19 in FY 2023).
Trump has pledged to "unleash" American oil and gas and these 15 US stocks have developments that are poised to benefit.
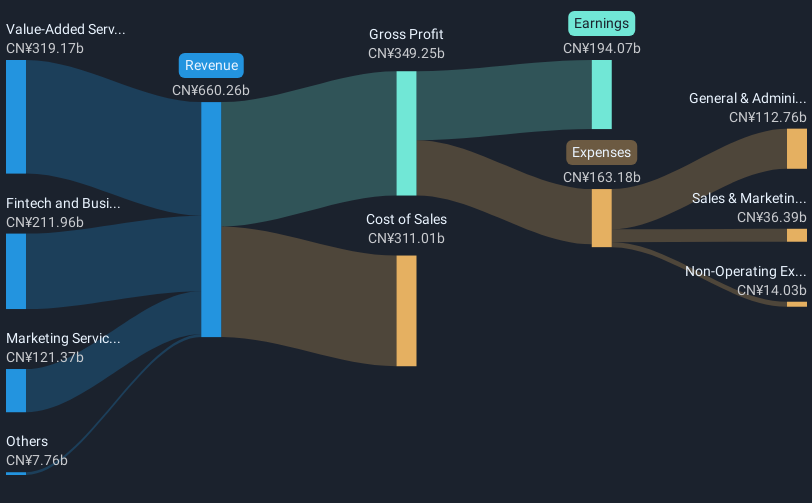
All figures shown in the chart above are for the trailing 12 month (TTM) period
Tencent Holdings EPS Beats Expectations
Revenue was in line with analyst estimates. Earnings per share (EPS) surpassed analyst estimates by 2.8%.
The primary driver behind last 12 months revenue was the Value-Added Services (VAS) segment contributing a total revenue of CN¥319.2b (48% of total revenue). The largest operating expense was General & Administrative costs, amounting to CN¥112.8b (73% of total expenses). Explore how 700's revenue and expenses shape its earnings.
Looking ahead, revenue is forecast to grow 8.1% p.a. on average during the next 3 years, compared to a 8.2% growth forecast for the Interactive Media and Services industry in Hong Kong.
Performance of the Hong Kong Interactive Media and Services industry.
The company's shares are down 1.9% from a week ago.
Balance Sheet Analysis
While earnings are important, another area to consider is the balance sheet. See our latest analysis on Tencent Holdings' balance sheet health.
If you're looking to trade Tencent Holdings, open an account with the lowest-cost platform trusted by professionals, Interactive Brokers.
With clients in over 200 countries and territories, and access to 160 markets, IBKR lets you trade stocks, options, futures, forex, bonds and funds from a single integrated account.
Enjoy no hidden fees, no account minimums, and FX conversion rates as low as 0.03%, far better than what most brokers offer.
Sponsored ContentValuation is complex, but we're here to simplify it.
Discover if Tencent Holdings might be undervalued or overvalued with our detailed analysis, featuring fair value estimates, potential risks, dividends, insider trades, and its financial condition.
Access Free AnalysisHave feedback on this article? Concerned about the content? Get in touch with us directly. Alternatively, email editorial-team (at) simplywallst.com.This article by Simply Wall St is general in nature. We provide commentary based on historical data and analyst forecasts only using an unbiased methodology and our articles are not intended to be financial advice. It does not constitute a recommendation to buy or sell any stock, and does not take account of your objectives, or your financial situation. We aim to bring you long-term focused analysis driven by fundamental data. Note that our analysis may not factor in the latest price-sensitive company announcements or qualitative material. Simply Wall St has no position in any stocks mentioned.
Comments