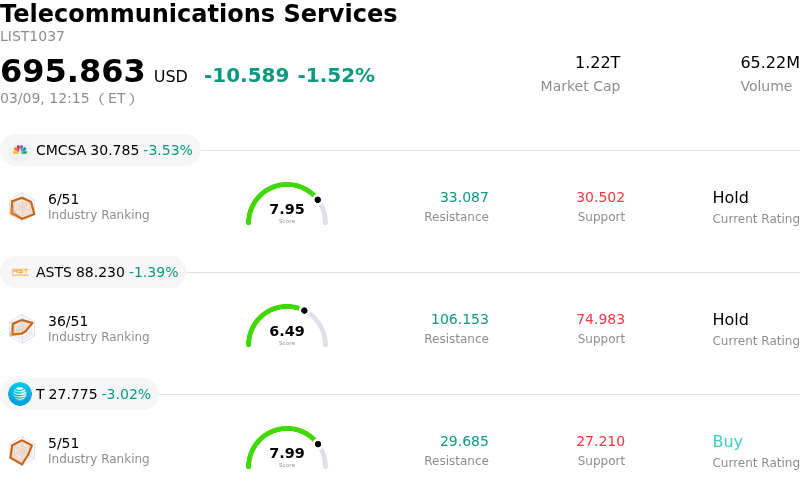
AT&T Inc (T) moved down by 3.02%. The Telecommunications Services sector is down by 1.52%. The company underperformed the industry. Top 3 stocks by turnover in the sector: Comcast Corp (CMCSA) down 3.53%; AST SpaceMobile Inc (ASTS) down 1.39%; AT&T Inc (T) down 3.02%.
What is driving AT&T Inc (T)’s stock price down today?
AT&T's share price decline today appears largely attributable to specific commentary provided by the company's Chief Financial Officer, Pascal Desroches, during the 34th Annual Media, Internet & Telecom Conference. Desroches indicated that AT&T anticipates its EBITDA performance and free cash flow for the first quarter of 2026 to be less than what the company expects for the full year. This forward-looking statement regarding a weaker initial quarter for key financial metrics likely prompted a negative reaction from investors, overshadowing the company's broader strategic reaffirmations.
Despite this short-term caution, AT&T reiterated its full-year 2026 financial and operational guidance, including projections for adjusted earnings per share between $2.25 and $2.35, adjusted EBITDA growth in the 3% to 4% range, and free cash flow exceeding $18 billion. The company also reaffirmed its commitment to return over $45 billion to shareholders through dividends and buybacks from 2026 to 2028.
The ongoing strategic focus remains on integrating recent acquisitions, particularly Lumen, and expanding its fiber optic network, aiming for over 40 million fiber passings by the end of the year. While AT&T faces challenges such as increased competition and integration costs within the telecommunications industry, which is characterized by mature, low-growth conditions, the company is actively working to enhance its wireless network and leverage its fiber assets to drive subscriber growth and improve customer convergence. The negative intraday movement suggests that the near-term outlook for Q1 performance took precedence over the reiterated full-year targets and long-term strategic initiatives in today's trading session.
Technical Analysis of AT&T Inc (T)
Technically, AT&T Inc (T) shows a MACD (12,26,9) value of [0.79], indicating a neutral signal. The RSI at 63.29 suggests neutral condition and the Williams %R at -25.90 suggests oversold condition. Please monitor closely.
Media Coverage of AT&T Inc (T)
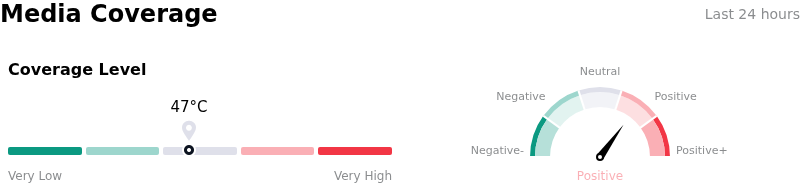
In terms of media coverage, AT&T Inc (T) shows a coverage score of 47, indicating a moderate level of media attention. The overall market sentiment index is currently in bullish zone.
Fundamental Analysis of AT&T Inc (T)
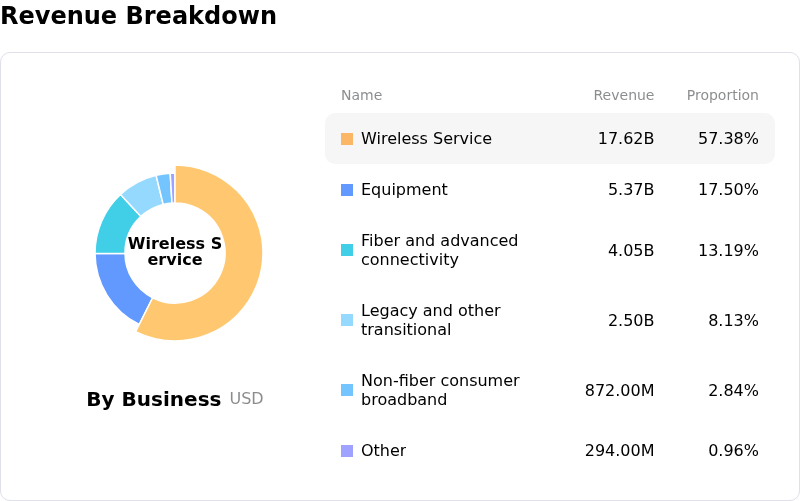
AT&T Inc (T) is in the Telecommunications Services industry. Its latest annual revenue is $125.65B, ranking 2 in the industry. The net profit is $21.89B, ranking 1 in the industry. Company Profile
Over the past month, multiple analysts have rated the company as Buy, with an average price target of $28.77, a high of $34.00, and a low of $20.00.
More details about AT&T Inc (T)
Company Specific Risks:
- The company faces ongoing governance scrutiny and potential for further shareholder activism following a recent settlement with New York City pension funds over the exclusion of a shareholder proposal seeking workforce demographic data disclosure.
- AT&T anticipates a weaker financial start to the year, with Q1 EBITDA and free cash flow expected to be lower than full-year projections, alongside a slower projected growth in wireless service revenue for Q1.
- Challenges from increased competition in the telecom sector and integration costs associated with the acquisition of Lumen's Mass Markets fiber business are expected to impact the company's operational efficiency and profitability.
- The company continues to grapple with high debt levels, with little excess capital available after a significant spectrum acquisition, prioritizing debt reduction which may limit other strategic investments or shareholder returns.
Find out more
Comments