Lately many people say today’s environment looks a bit like the 1970s, which raises two questions: who studies these big cycles most deeply, and is there a framework that ordinary investors can borrow? If I had to pick just one person to answer that, I would choose Ray Dalio.
He founded Bridgewater Associates, one of the world’s largest hedge funds by assets under management. In 2025 its flagship Pure Alpha fund returned 33% for the year, while the S&P 500 rose about 17% over the same period. Looking further back, in 2008 during the global financial crisis when most funds suffered double‑digit losses, it still managed to post a positive return. Dalio has written his thought process into public principles whose core is using historical data to extract reusable macro tools. In this piece, we break down the parts he uses most often and that are most accessible to ordinary investors: the debt‑cycle framework, the four economic seasons, the All-Weather portfolio, the long‑term cycle of world order, and where gold sits inside this system.
Framework 1: The Debt Cycle – The Key Macro Coordinate System
Dalio’s starting point for macro can be summed up in one sentence: economies move in cycles, and the driver of those cycles is debt, not sentiment.
He breaks the debt cycle into two levels:
- Short‑term debt cycle (5–8 years) This is what we usually call the business cycle. Credit expands, consumption rises, the economy heats up, and stocks enter a bull market; then inflation picks up, central banks tighten, credit contracts, the economy cools, and stocks correct; after that the central bank is forced to cut rates and inject liquidity, and a new cycle begins. This loop takes roughly five to eight years and is the line most macro analysts keep their eyes on day to day.
- Long‑term debt cycle (roughly 50–75 years) Most people can only live through one of these in full, so it is often ignored. Its logic is this: at the bottom of each short‑term cycle, central banks usually pull the economy out of the trough with lower interest rates and looser credit. Each time, the debt level at the bottom ends up higher than the last round. Over time, total debt relative to income grinds steadily upward and interest rates are pushed steadily downward. Eventually rates approach levels where they can hardly be lowered further, conventional monetary policy is almost out of room, and any further easing starts to damage confidence in the currency system itself.
That is typically the high‑plateau zone of the long‑term debt cycle, the eve of structural change in the monetary and financial order.
He does not rely on “feel” to judge how close we are to that zone, but on several concrete indicators.
Indicator 1: Debt‑to‑GDP ratio
This is the most straightforward gauge of leverage in the system: the combined debts of government, corporations, and households as a share of GDP. In works such as “Big Debt Crises” Dalio has surveyed many historical cases and finds that when total debt‑to‑GDP stays at very high levels over long periods (roughly 200%–300% or more), the system tends to be fragile. Once a large external shock hits, it is almost only a matter of time before you see large‑scale deleveraging, debt restructuring, or high inflation being used to solve the debt problem.
Indicator 2: Interest expense as a share of government revenue
This is a point he has hammered repeatedly in recent years, because it speaks more directly than headline debt to one question: how long can this debt burden be sustained? Put simply, it measures how much of the government’s annual revenue has to go to interest payments. When talking about the U.S. fiscal outlook, Dalio has often warned that as interest costs take up a rising share of the budget and approach historical highs, the system is increasingly rolling over old debt and interest with new borrowing, a typical pattern seen before many sovereign debt crises.
Take today’s United States: in fiscal year 2025 net interest outlays are around 970 billion dollars, roughly 19% of federal revenue, and under the Congressional Budget Office’s baseline, that figure is projected to exceed 2 trillion dollars by 2036 with the share of revenue continuing to increase.
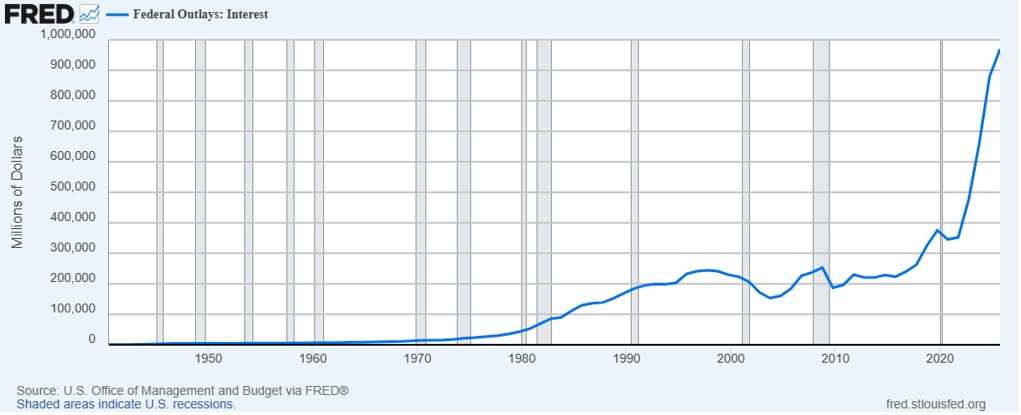
Source: Federal Reserve Bank of St. Louis
Indicator 3: The level of real interest rates
This is the core variable in monetary policy and in Dalio’s framework the indicator most directly linked to gold. The formula is simple:
Real interest rate = nominal interest rate − inflation rate.
· When real rates are positive and not low, holding government bonds yields a real return, so the opportunity cost of holding gold is relatively high.
· When real rates are near zero or drop negative, you may receive coupons in nominal terms but your purchasing power quietly erodes, so capital naturally looks for assets that are not squeezed by both default risk and inflation. That is when gold starts to look more attractive.
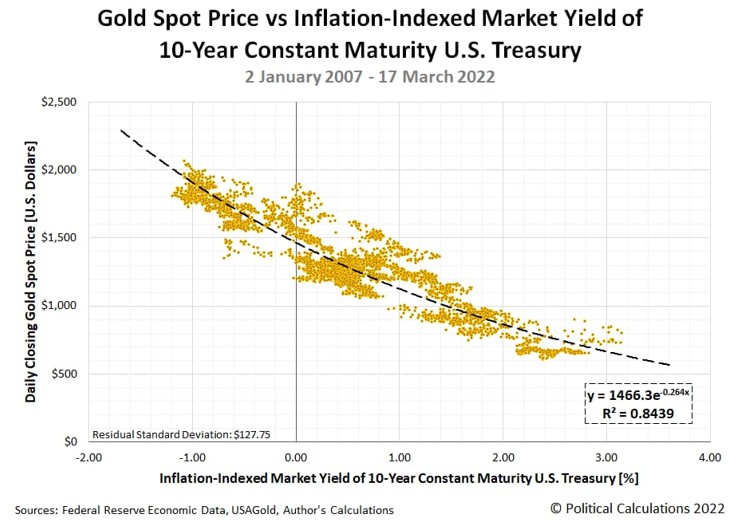
Source: Political Calculations
If you plot the real yield on 10‑year inflation‑protected Treasuries (TIPS) against the gold price, you can see that the two move in opposite directions over many periods: when real yields trend down, gold often trends up.
In an October 2025 Q&A, Dalio essentially followed this logic. He argued that the supply of U.S. and other sovereign bonds far exceeds natural demand at present, which exerts persistent downward pressure on long‑term real rates. In such an environment, capital is gradually migrating from sovereign debt that depends on government credit to gold and similar assets that do not rely on any single sovereign, while the growth rate of gold supply itself is quite limited. This mismatch is likely to persist for a long time.
Putting these three indicators together gives you a rough answer to two questions: where roughly we stand on the long‑term debt cycle, and along this stretch of the path whether gold’s necessity in a portfolio is being weakened or pushed higher.
Framework 2: Four Economic Seasons and the Winners in Each
Knowing where you stand in the debt cycle is the first step. The next is to ask, given today’s macro environment, where should capital flow?
Dalio uses a vivid metaphor to tackle this problem: the four economic seasons. He compresses the environment into two dimensions:
- Is growth rising or falling?
- Is inflation rising or falling?
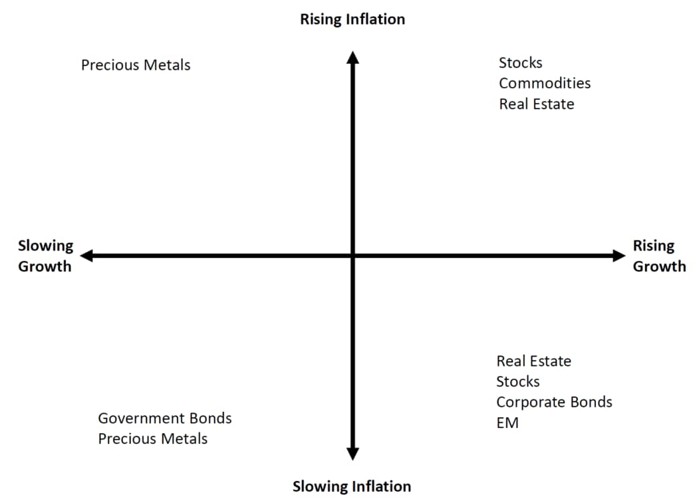
Source: Process Driven Macro
Each quadrant lines up with different patterns of asset performance, and many macro studies build on this and borrow the four‑seasons language to summarize how major asset classes tend to behave:
Season | Growth | Inflation | Best performing assets | Worst performing assets |
Spring | Rising | Falling | Equities | Commodities |
Summer | Rising | Rising | Commodities, inflation linked bonds | Long duration nominal government bonds |
Autumn | Falling | Rising (stagflation) | Gold, real assets | Equities, long duration government bonds |
Winter | Falling | Falling | Long duration bonds, cash | Commodities |
Several points in this framework merit reflection.
First, no asset wins in every season. This sounds like common sense, but many real‑world portfolios are built as if spring will never end: they tilt heavily to equities over the long run, or even to a single equity style such as pure growth tech. When the season turns to autumn, this kind of portfolio tends to fall as one solid block. The year 2022 was a textbook autumn: under high inflation and rapid rate hikes, both U.S. equities and long‑term Treasuries posted double‑digit losses, while gold was roughly flat for the year and outperformed almost all mainstream assets.
Second, gold behaves more like an autumn asset. It does not rise all the time; it shines in specific combinations: when growth is slowing and inflation is rising, or when the monetary system and sovereign credit are under pressure. The common misunderstanding is to treat gold as a safe‑haven asset that always goes up in times of trouble. Its logic is more precise: when the real returns of other major asset classes are simultaneously squeezed, gold as a physical asset without counterparty risk attracts inflows.
Third, seasons do not change by the calendar but are driven by policy moves and data. The period from 2020 to 2021 was spring (massive easing plus economic recovery, equities soaring). In 2022 the environment flipped to autumn (rate hikes and inflation, stagflation traits, both stocks and bonds selling off). From 2023 to 2024 the regime swung repeatedly between soft‑landing and re‑inflation scenarios; some stretches looked like back‑and‑forth between winter and spring. To judge the current season you focus on a few key data points:
- PMI trend (for growth);
- CPI trend (for inflation);
- Real interest rates (for policy tightness);
- Credit spreads (for the state of credit conditions).
In today’s environment (2026), U.S. GDP growth has already slowed, inflation has backed down from its peak but remains sticky, geopolitical conflict keeps upward pressure on energy prices, and monetary policy faces a dilemma. Against this backdrop, the strains of the long‑term debt cycle are becoming more visible while the short‑term cycle swings between autumn and winter. That is why, even after rate hikes and a phase of dollar strength, gold has still managed to maintain relatively strong performance over the past one to two years.
Framework 3: The All-Weather Portfolio – A System That Does Not Depend on Forecasts
The four‑seasons framework gives you diagnostic tools, but there is a practical problem: correctly identifying the economic season is extremely hard, and even professional institutions are frequently wrong.
Dalio’s solution is: do not try to get it right every time; instead, build a system that can survive in any season. That is the design logic of the All Weather portfolio.
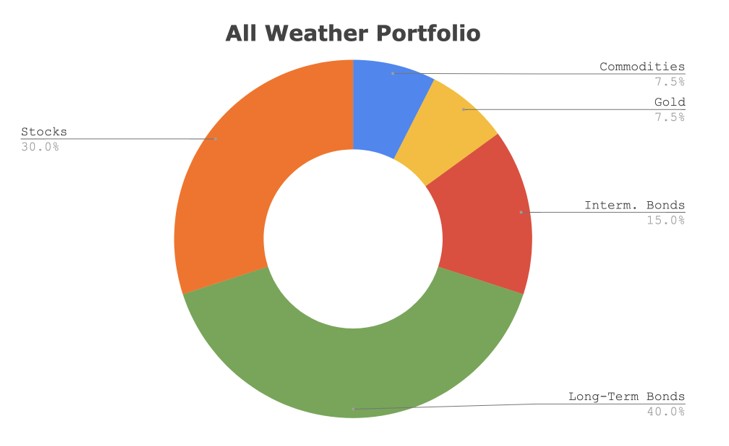
Source: Optimized Portfolio
A typical All-Weather allocation looks roughly like this:
- 30% equities – to capture the growth premium of spring
- 40% long‑term government bonds – to protect against winter deflation
- 15% intermediate‑term government bonds – as a liquidity buffer
- 7.5% gold – to cover autumn and periods of monetary system stress
- 7.5% commodities – to cover summer inflation
There is a key point here: this 30/40/15/7.5/7.5 split is not arbitrary but derived from risk‑contribution calculations, the idea known as risk parity.
In a traditional 60/40 stock‑bond portfolio, the surface allocation looks diversified, but because equity volatility is much higher than bond volatility, 80%–90% of the portfolio’s risk actually comes from stocks. This means that when the economy sours, the whole portfolio tends to fall in line with equities.
The logic of risk parity is to let each asset class contribute roughly equal risk to the overall portfolio. Because bonds are low‑volatility, you must hold more of them (typically with leverage) for their risk contribution to match that of equities. Gold and commodities are high‑volatility, so at 7.5% weights their risk contributions can be brought into line with 30% equities.
This 30/40/15/7.5/7.5 mix is closer to a long‑term strategic allocation than a static set of positions you buy and never touch. In practice Dalio has not said clearly whether one should hold these weights permanently or rebalance on a fixed schedule back to the target mix, but based on common multi‑asset practice, it is likely the latter, to avoid any one asset dragging the portfolio’s risk profile offside after a strong run. The exact rebalancing frequency and method still have to be set by each investor according to their own risk tolerance, capital size, and habits.
Source: Dollars And Data
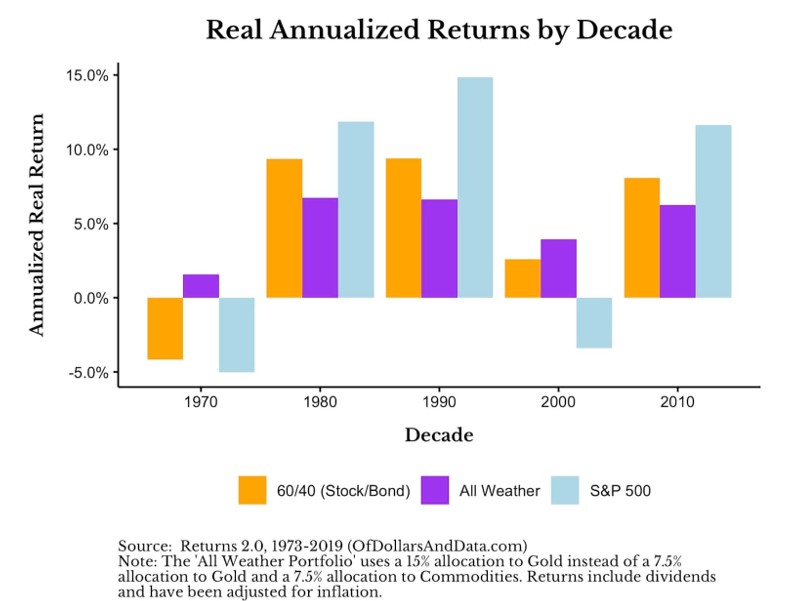
Backtests over several decades show that All Weather usually delivers a lower annual return than a pure equity portfolio, but its losses are much smaller in big downturns. For example, in 2008 the S&P 500 fell nearly 38%, while commonly used All Weather variants did post negative returns but drawdowns were generally much smaller than pure equity portfolios.
However, Dalio has stressed an important caveat: All Weather was designed for institutional investors and professionals with access to leverage tools. If retail investors simply copy the weights, they may end up disappointed because the high bond allocation can underperform expectations in inflationary environments. The value for ordinary investors lies less in cloning the percentages than in adopting the mindset of covering all seasons and understanding the structural role gold plays in the system.
As for gold’s specific weight, Dalio has given several ranges in different venues:
- In relatively normal environments, he has mentioned many times that a 5%–10% gold share of total assets is a useful reference;
- In today’s kind of environment with high debt, elevated inflation risk, and pressure on the monetary system, he suggested in October 2025 that investors consider raising gold’s strategic allocation to close to 15%.
His point then was that today’s macro situation resembles the early 1970s in many ways, the period when the Bretton Woods system collapsed and the monetary order was restructured. In that environment investors who held assets heavily reliant on fiat currency saw their real purchasing power badly eroded, whereas those who allocated some gold were better able to preserve wealth.
Framework 4: The Long‑Term Cycle of World Order – The Deep Logic of Monetary Systems
The previous three frameworks help you decide which assets to hold under different macro regimes. This fourth one addresses a deeper question: why does gold’s status rise structurally in certain historical periods?
Dalio spent several years studying the rise and fall of major powers over the past 500 years and distilled a repeating grand cycle he calls the changing world order.
The core mechanism goes like this:
- An empire rises on the back of strong competitiveness, high institutional trust, and a sound monetary system. At its peak its currency becomes the global reserve, and other countries are eager to hold its bonds. This allows it to finance itself extremely cheaply and maintain global dominance.
- Over time it over‑consumes, fiscal deficits widen, and debt piles up. To keep the system going it prints more and more money. Foreign investors holding its bonds begin to notice the risk of currency debasement and gradually reduce their holdings, shifting into other assets. The reserve‑currency status begins to wobble.
- Near the end of this process, history has repeatedly shown the same pattern: capital moves out of fiat‑currency debt instruments into gold and other real assets. Dalio calls this the great shift from financial wealth to real wealth.
The year 1971 is a textbook case. President Nixon closed the gold window and severed the dollar’s convertibility into gold, ending Bretton Woods. Over the following decade the dollar depreciated sharply, while gold surged from 35 dollars an ounce to 850 dollars in 1980, more than a 20‑fold increase. Investors who clung to Treasuries and cash saw their real purchasing power gutted, while those holding gold preserved their wealth.
Why does this logic still apply today?
Look at a few concrete numbers. In fiscal 2025 the U.S. federal government’s interest bill is about 970 billion dollars, or roughly 19% of revenue—almost one out of every five dollars collected goes to interest. Projections show this ratio rising further, reaching about a quarter of revenue by 2036, meaning interest will increasingly crowd out other spending.
In his 2025 book “Why Countries Go Broke,” Dalio wrote that when the cost of servicing debt persistently outstrips income growth, the system has only two exit routes: default, or printing money to debase the currency. Historically, sovereigns with monetary sovereignty have almost always chosen the latter. The result of debasement has also followed a consistent pattern: holders of paper debt suffer losses, while holders of gold and real assets relatively preserve purchasing power.
Against this backdrop Dalio stressed repeatedly in late 2025 and early 2026, including at Davos, that gold has effectively become the world’s second‑largest reserve asset after the dollar. This is not some one‑off emotional trade but the collective response of central banks and large institutions rethinking the safety margin of the monetary system. In recent years central banks around the world have been buying gold reserves on a large scale and gradually substituting it for U.S. Treasuries in their FX reserves, a capital‑market response that fits this logic.
Framework 5: Five Interlocking Forces – Why Today Is a Critical Juncture
This is a composite framework Dalio has emphasized frequently of late. He summarizes the evolution of today’s world as five interacting forces, and in February 2026 at the World Government Summit in Dubai he gave a systematic account of them.
In his telling, what drives the world today is not one single economic storyline but five powerful forces that are all highly active and mutually reinforcing:
Force 1: The debt‑and‑money cycle As analyzed above, debt has built up to critical levels and the monetary system is under structural pressure. This is the deepest driver of gold’s long‑term behavior.
Force 2: The domestic political cycle Income and wealth inequality widen, values polarize, populism rises, and institutional effectiveness declines. That directly undermines the sustainability of fiscal policy: the more polarized politics becomes, the harder it is to make tough fiscal‑consolidation decisions, and the harder it becomes to fix the debt problem.
Force 3: The geopolitical cycle The incumbent hegemon clashes with rising challengers, and existing multilateral arrangements start to falter. In such an environment, financial assets and capital flows themselves become geopolitical weapons. Sanctions, asset freezes, and fragmentation of payment systems all push more countries to shift reserves from dollar‑denominated debt to gold.
Force 4: The technology wave Disruptions from AI and other technologies boost productivity but also exacerbate labor‑market polarization and widen inequality, which in turn feeds back into force 2’s political effects.
Force 5: Natural forces Pandemics, climate events, and other exogenous shocks can inflict massive short‑term damage on economic activity, sometimes rivaling wars in scale.
Dalio notes that each force on its own has been managed with some success in the past, but what is truly rare is that all five are now simultaneously running hot and reinforcing one another. That stacked configuration of major cycles has often been the backdrop for historical turning points.
For gold investors, gold’s value does not come solely from any single factor (such as inflation or a one‑off crisis). It lies in the structural protection it offers when confidence in the currency and financial systems is eroded by multiple forces working together. When all five forces are highly active, the probability and intensity of such erosion increase, and gold’s strategic role in portfolios is raised systematically.
Turning Frameworks into Tools: A Three‑Dashboard Setup
If you leave these frameworks at the level of concepts, they are still too abstract. Let’s turn them into a checklist of indicators you can review regularly. Dalio himself uses a similar dashboard approach to track where we are in the economic cycle.
Dashboard 1: Position on the debt cycle
Indicator | Current figures | Dalio’s warning zone |
Government debt to GDP | U.S. around 124% | Staying well above 100% for long stretches usually means fiscal and monetary space are materially constrained |
Interest costs as a share of revenue | U.S. about 18%–19% (FY 2025) | Once the share rises above the mid-single digits it begins to crowd out other spending, and after ~15% the pressure escalates quickly |
Real rate (10-year TIPS yield) | About +2% (roughly 1.8%–2% in early 2026) | When it approaches zero or turns negative, history often shows a marked pickup in demand for gold and other real assets |
Dashboard 2: Identifying the economic season
Indicator | What to watch | Where to get data |
Manufacturing PMI trend | Above 50 signals expansion and below 50 contraction, but the trend matters more than the level | ISM monthly reports |
CPI year on year and month on month | Whether inflation is heating up or cooling | Monthly BLS data |
Real GDP growth | Strength of growth momentum and whether it is clearly slowing | Quarterly BEA releases |
Credit spreads (investment grade/high yield) | Widening spreads usually mean rising economic and credit stress | FRED data |
Dashboard 3: Gold‑specific triggers
Indicator | Typical gold response |
Real rates falling or turning negative | Historically, falling real rates—especially near zero or below—tend to coincide with stronger gold prices |
A weaker dollar index | All else equal, a weaker dollar often goes hand in hand with higher dollar denominated gold prices |
Central bank gold purchases | Persistent net buying is a sign of structural support |
Geopolitical risk premium | Spikes often trigger short term jumps in gold; you must judge whether they are one off shock or part of a trend |
Money supply growth (M2 year on year) | When M2 growth accelerates significantly, inflation expectations rise and medium-term support for gold tends to build |
This dashboard approach is not for trading daily off these numbers. It is for reviewing them systematically each quarter, judging which quadrant the macro environment sits in, whether a quadrant shift is underway, and whether gold‑specific trigger conditions are forming.
The Essence of Dalio’s Methodology: A Cognitive System, Not a Signal Box
Taken together, Dalio’s investment methodology has a philosophical keystone he repeats throughout books like “Principles”:
Radical truth, radical transparency.
Applied to investing, this has a concrete meaning: when market reality diverges from your model’s predictions, your first reaction should be “where is my model flawed?” not “the market is wrong.”
In 1982 he nearly went broke because his analysis only captured half the story. He correctly anticipated that Mexico would default, but he failed to model the Federal Reserve’s response to that variable. After that he built a system at Bridgewater requiring every investment call to have a clear logic chain and to be reviewed against actual outcomes afterwards, with the principles library continually updated.
That way of operating gave him an asset that is nearly impossible for others to replicate: thousands of rules road‑tested by history, each one backed by an earlier mistake and a systematic fix.
For ordinary investors, the takeaway is not to copy his allocation weights but to cultivate this way of thinking:
- Understand which macro environments favor each asset you hold and which ones hurt it. Do not treat a drawdown in an autumn environment as a “short‑term dip” if you are holding spring assets.
- Treat gold as a structural hedge rather than a directional trade. It is not just something to buy and sell opportunistically; it plays the role of stabilizer when other assets are failing at the same time. Dalio’s advice is to hold it as a strategic position, not a pure timing play.
- Periodically check whether your macro season is changing. You do not need daily calls, but each quarter you should ask: is growth accelerating or decelerating? Is inflation heating up or cooling? Which parts of your portfolio are running with the wind, and which into the wind?
- Stay humble about your own calls and leave room for being wrong. Dalio’s All Weather framework is, at bottom, an institutionalized admission that “I do not know what the next season will be.”
Gold Today: From Framework to Reality
Back at today’s specific point in time, Dalio’s frameworks point in a fairly consistent direction:
- Debt‑cycle dimension – The U.S. is in a highly fragile zone of the long‑term debt cycle, with interest payments taking a share of revenue that is already near historical highs and projected to rise further.
- Four‑seasons dimension – The current macro features slowing growth plus sticky inflation, more like a mix of autumn and winter than spring.
- Long‑cycle dimension – The global reserve‑currency system is loosening structurally; in recent years central banks have been net buyers of gold on a large scale while gradually reducing reliance on U.S. Treasuries and other single‑sovereign debt in their reserves.
- Five‑forces dimension – All five forces (debt and money, domestic political strain, reshaping of the global order, technological upheaval, and natural shocks) are running at high intensity and reinforcing each other, putting both uncertainty and system fragility at historically elevated levels.
Each individual framework leads to the same conclusion: gold’s role as a structural hedge against monetary and credit‑system risk is becoming more valuable, not less. When the frameworks are overlaid, that conclusion becomes even harder to dismiss with any single data point.
In early 2026 public remarks Dalio has stressed that his view on gold is not about short‑term price moves but about long‑run structural shifts in the monetary system, debt structure, and geopolitical landscape. Through that process, gold—an asset with neither national nor counterparty risk—will see its demand trend higher.
At the same time, he has emphasized an even more important point, which underpins his whole methodology: no judgment is ever certain, including his own. When you hold a view, you must also ask yourself: if I am wrong, where exactly would the error lie?
In my view that is the truly valuable lesson behind all of Dalio’s frameworks. The real focus is not any fixed allocation formula but a clear‑eyed view of uncertainty and a systematic method for dealing with it.
In this piece we have unpacked Dalio’s core methodology: the debt‑cycle framework, the four‑seasons framework, the All-Weather portfolio, the long‑term world‑order cycle, and a dashboard of macro indicators you can review regularly. None of these is a standalone tool. Together they form a coordinate system for your thinking, helping you judge where you are in the big cycles, what role each asset in your portfolio plays in today’s environment, and why within this coordinate system gold looks more like a structural must‑have than an optional add‑on.
If you found this useful, bookmark it and come back to it. See you in the next piece.
This content is for investor education only and does not constitute investment advice. All historical data cited come from public sources, and past performance does not guarantee future results. Investing involves risks; be cautious when entering the market.
Find out more
Comments