TradingKey - Ethereum surged over 12% in the last 7 days, currently forming a W pattern and flashing a strong bullish signal.
On July 6, the price of Ethereum ( ETH) followed the broader market rebound, approaching the $1,800 mark and peaking at $1,799.88, close to its mid-June high. Currently, the ETH price has pulled back slightly, trading at $1,771.6.
Recently, the unexpected weakness in the US June non-farm payrolls data weakened market expectations of a Fed rate hike in September, with investors turning to price in an easing monetary policy, triggering a crypto rally. Among them, Ethereum surged over 12% in the last 7 days, far outperforming Bitcoin ( BTC ). During the same period, the largest crypto asset by market cap only rose by about 5%.
In early June, the price of Ethereum fell to the $1,500 mark. At the end of June, it pulled back near this level again but did not break below it, also showing stronger performance than Bitcoin. In early June, Bitcoin's price fell to around $59,000, but lost this support level at the end of the month, dropping to $58,000. Now, with Ethereum's price rising again to near $1,800, forming a W pattern with the price trend in June, what does this actually mean?
In technical analysis, the W pattern, also known as a double bottom, is a classic and highly reliable bullish reversal signal. It typically appears after a stock or asset price has undergone a period of "downtrend," signifying that the market's downward momentum is exhausted, and bulls (buyers) are regaining control, with the trend about to shift from bearish to bullish. Next, if Ethereum breaks through and stabilizes above the $1,800 mark on high volume, it will completely open up upside potential, with hopes of rising an additional 30% from this base to challenge the $2,400 level, which was the peak of the April and May rebounds this year.
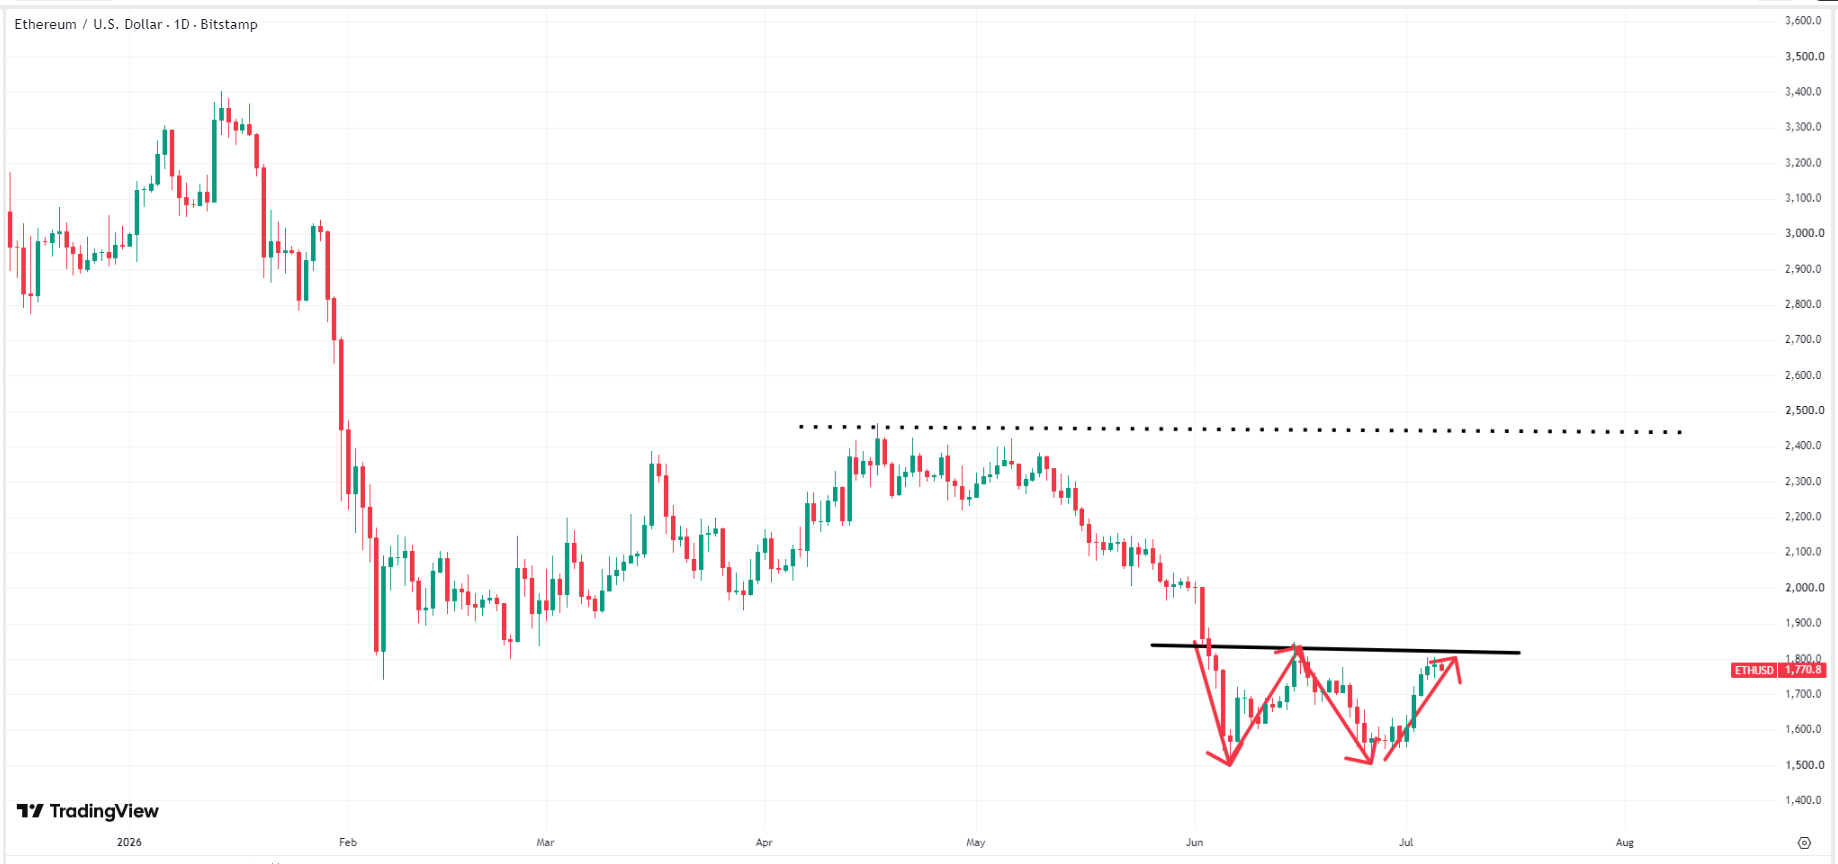 Ethereum price chart, Source: TradingView
Most importantly, the short-term outperformance of Ethereum over Bitcoin sends a positive signal that market risk appetite is returning, with capital shifting to high-beta assets. In the crypto market, Bitcoin is viewed as a defensive "digital gold," while Ethereum is closer to "tech growth stocks."
When the market faces negative news, capital prefers to retreat to BTC for safe-haven purposes. However, when macro tailwinds ignite the market and fear eases, capital rapidly flows into more elastic and volatile Ethereum and other altcoins, such as Hyperliquid ( HYPE ), Zcash ( ZEC ), Stellar ( XLM ), and Cardano ( ADA ), in pursuit of "excess returns." These tokens have risen 13%, 19%, 18%, and 27% respectively over the past 7 days.
Find out more
Comments