TradingKey - On July 22, Eastern Time, Google's parent company Alphabet ( GOOGL) released its latest earnings report. According to the financial data, the company's latest second-quarter earnings showed overall strong performance, with both revenue and cloud business beating market expectations. However, the stock price fell instead of rising after the announcement, dropping 3.31% in after-hours trading. This was primarily due to investor concerns over the continued rise in the company's AI infrastructure capital expenditures, free cash flow turning negative, and the payback period of its AI investments.
Google Parent Alphabet Earnings Beat Expectations, AI CapEx Weighs on Shares
According to its latest earnings report, Alphabet's second-quarter performance was not weak. The company's quarterly revenue reached $119.8 billion, up 24% year-over-year, higher than market expectations of approximately $116.9 billion to $117.1 billion. Google Cloud became the standout performer of the quarter, with revenue reaching $24.8 billion, up 82% year-over-year, indicating that demand for AI computing power, enterprise cloud migration, and TPU chip-related businesses are driving accelerated growth in cloud revenue.
The advertising business remains Google's most stable cash cow. Alphabet's second-quarter advertising revenue was $81.6 billion, basically in line with market expectations. Although AI search is changing the way internet traffic is distributed, this quarter's earnings report shows that Google Search, YouTube, and the advertising ecosystem have not experienced any significant slowdown, and the core advertising business continues to support the company's profit and cash flow foundation.
However, the market's reaction to Alphabet's earnings report was cautious, with the core issue being the continued rise in AI capital expenditures. The company raised its full-year capital expenditure guidance for 2026 from the previous $180 billion to $190 billion to $195 billion to $205 billion. CFO Anat Ashkenazi stated that the upward revision in capital expenditures was mainly because the company needs to accelerate the expansion of its computing power and data center capabilities to meet AI-related demand.
AI investment helps drive the development of Google Cloud, Gemini, AI Overviews, AI Mode, and TPU businesses, but a too-rapid rise in capital expenditures will also squeeze free cash flow. The financial report showed that Alphabet's second-quarter free cash flow was -$5.9 billion, which exerted clear pressure on the stock price.
In terms of the impact on the stock price, while Google's current performance is strong, its spending is even stronger. Revenue, the cloud business, and advertising revenue support the fundamentals, but the upward revision of AI capital expenditures has diluted the positive news from the earnings report. For investors, if Google Cloud continues to maintain high-speed growth in the coming quarters and proves that AI investment can translate into higher cloud revenue, advertising efficiency, and enterprise AI service revenue, there is still room for GOOGL's stock price to recover; however, if capital expenditures continue to outpace cash flow growth, the market may continue to compress the valuation.
Google Stock Technical Analysis
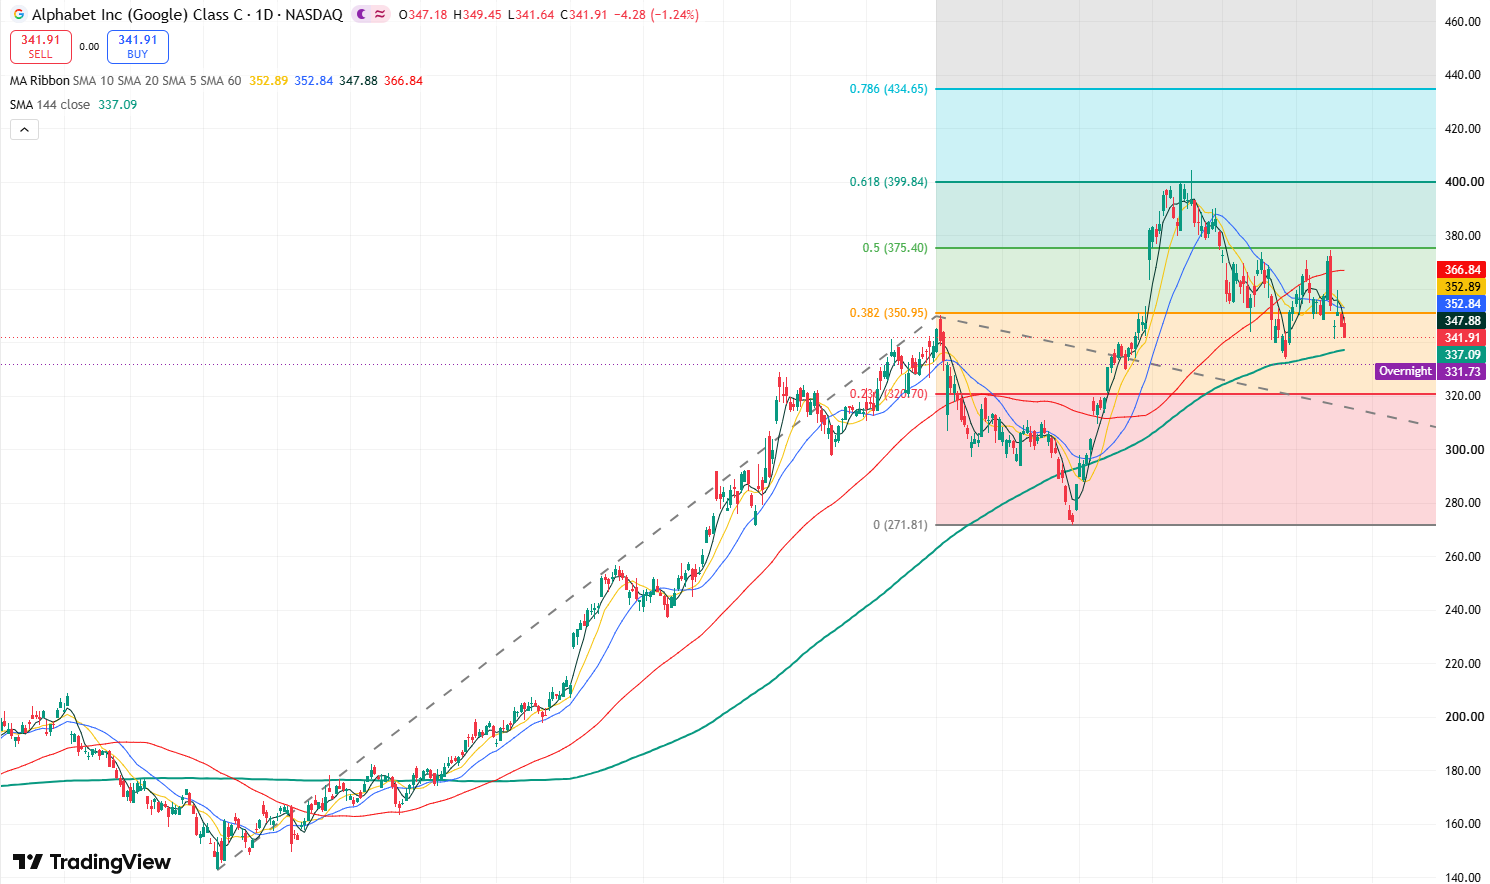
Google stock daily chart, Source: TradingView
According to Google's daily chart, the stock price previously pulled back from its historical high of $404.47 to $333.69. While it rebounded with support from the 144-day moving average, the price fell back under pressure after reaching the $375 resistance level. Short-term bearish momentum has strengthened, and the stock may continue to decline.
Currently, recent price movements show a phase of high-level consolidation. In the short term, the stock may continue to test support near the 144-day moving average, namely the $337-$333 range. If the price breaks below $333.69, it could further test support in the $320-$300 range; if it drops below $300, the stock price may fall further toward around $270.
On the upside, if the stock price stops falling near the 144-day moving average again, it may test $375. If it can break through this resistance level, it will open up upside room toward $400, and a further breakout above $400 could see the stock rise toward $500.
Find out more
Comments