TradingKey - Advanced Micro Devices (NASDAQ: AMD) moved upward by 7.7% to around $513 on November 6 during regular trading prior to the release of their Q2 2026 results. However, when results were released after regular trading, a decline of 8% to 9% was recorded. This was due to revenues and EPS coming in better than expected, and a guidance increase for Q3 of $12.7 to $13.3 billion, which exceeded the $12.5 billion target.
Gross margin was reported at 54%, which was below the 56% consensus expected for the full year, and this is what the market is considering after hours. This has become a pattern for AMD, following their Q4 2025 results where they recorded a 15.98% EPS beat with a -17.31% session reaction. Currently sitting at $486, the $460.55 support zone is the important area to consider for the upcoming open at $513.
What AMD Actually Reported
AMD’s Q2 revenue was $11.536 billion, reflecting a 52% increase year-over-year from the $7.6 billion reported the year before. This beat $11.284 billion by 2.2%. Adjusted EPS came in at $1.66, beating the $1.62 estimate. Growth was largely attributed to the Data Center segment, representing over 58% of the revenue (a $6.7 billion segment, which is an implied 57% YoY revenue growth from Q1) and beating the $6.0 billion Polymarket consensus. Growth in the segment was attributable to Anthropic, Meta, and OpenAI, along with Rack Scale Systems.
Q3 guidance was raised to $12.7 to $13.3 billion, reflecting a $13.0 billion midpoint and a $12.5 billion consensus, suggesting continued sequential revenue growth through the second half 2026, with Q3 at $12.5 billion and Q4 at $15.7 billion, both of which are above Wall Street estimates.
Gross margin slipped to 54% against a consensus estimate of 56% for the full year at TIKR. Jean Hu, AMD's CFO, mentioned margin pressure for the near term due to the ramp of Helios. The revenue mix will shift toward lower initial margin AI accelerators over time. This pushes the question on the potential necessity to ramp Helios ahead of the schedule previously communicated by AMD and their ability to reach their long-term objective to sustain a non-GAAP operating margin in excess of 35% and EPS exceeding $20 within the target period of 3 to 5 years.
The Pattern - AMD Beats and Falls
In Premier Fiscal Q4 of 2025, AMD delivered better than expected EPS by a whopping 15.98% only to see a decline of 17.31%. This was caused by investor fear over margin compression and vague comments about China made by AMD executives. A few months later in Fiscal Q1 of 2026, EPS once again beat expectations by 5.88%, but instead of a decline, the share price skyrocketed by 18.61%. This was largely a result of record breaking 46% server CPU market share and a bullish $120+ billion 2030 TAM. The beat was not as materially large, but instead, better than expected gross margin and targeted guidance were the primary drivers of the bullish response.
Like the Q4 of 2025, once again, an EPS beat and better than expected revenue were overshadowed by a gross margin miss and more strong targeted guidance. A targeted sell by AMD CEO Lisa Su of 200,000+ shares also played a large role in pushing AMD stock down ahead of earnings. Earnings were scheduled for a 7.7% rally to $513 and the strong targeted guidance gave AMD a mountainous opportunity.
The Q3 Guidance and Why It Is Not Enough Tonight
The most signals AMD has provided with Q3 guidance at $12.7 billion to $13.3 billion. The midpoint of $13.0 billion is $500 million above the $12.5 billion consensus, which shows a 70% growth in comparison to last year. Investing.com notes that ''a guidance raise toward $12.5 billion-plus for Q3 would likely send the stock higher.'' That did not happen.
The guidance miss at a gross margin of 54% was more important to investors because those modeling a $20 EPS within 3-5 years need to see the trajectory path that takes us from 54% gross margin and a big Helios ramp to the gross margins that yield an EPS of $20, and a 54% gross margin with a Helios ramp in Q3 does not help that path.
AMD Technical Setup
On the daily chart, AMD trades at around $486 after hours. Given the daily chart structure, AMD has rejected the $530.47 trendline resistance, and is trading below both the 50 period EMA ($491.16) and 100 period EMA ($505.79). Market momentum, RSI, has cooled to around 47. The major support zone at $460.55 will likely be the key level traders watch for today. It has been an active support zone in the recent weeks.
As long as AMD maintains its current price above $460.55, traders will continue to have hope for an upside recovery, and price potentially testing the levels at $491 and $505. A close below $460.55 would bring focus to the next major zone at $420.46, and potentially even $393.28.
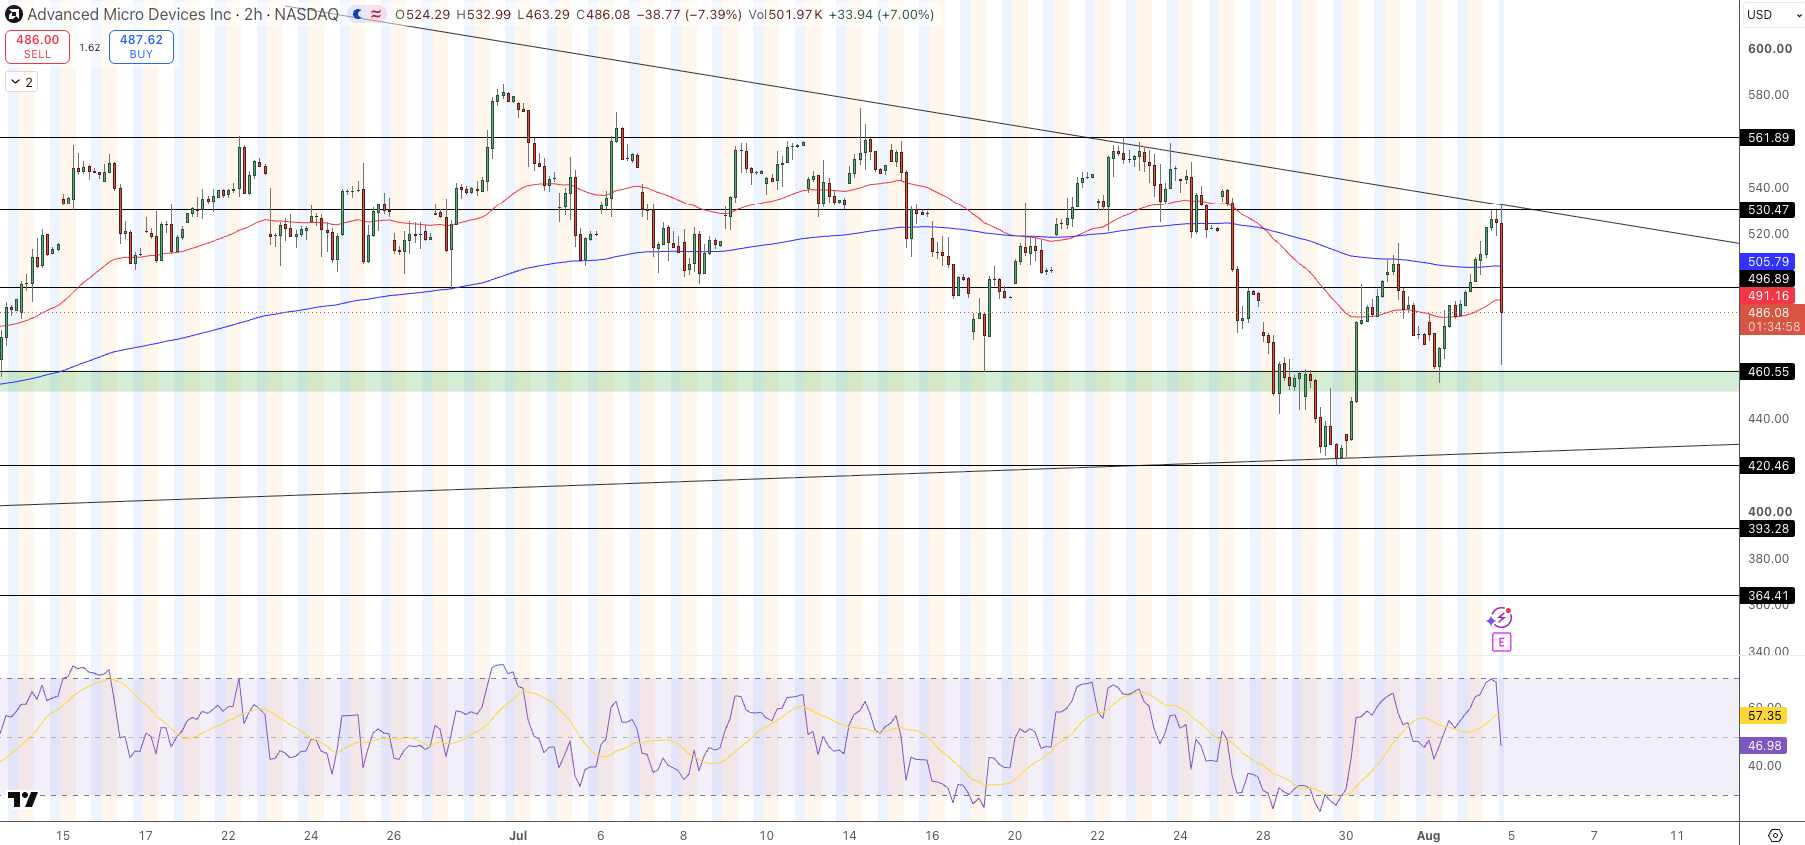
AMD Price Chart - Source: Tradingview
The pre-earnings rally of 7.7% that pushed AMD up to $513 erased most of its pre-earnings gains in the post-earnings reaction.
Key Levels
- Normal Session: Rose 7.7% to ~$513. After-Hours: Fell 8-9% to ~$486 on Results
- Q2 Results: Revenue $11.536B vs $11.284B (+2.2% beat). +52% YoY. Adj EPS $1.66 vs $1.62
- Gross margin: 54% - below 56% consensus target. Helios ramp creating near-term margin pressure
- Q3 Range: $12.7B-$13.3B. Midpoint $13.0B beats $12.5B consensus. +70% YoY
- Data Center: 58%+ of Q2 revenue ($6.7B). ~$6.0B Polymarket consensus beat
- Pattern: Q4 2025 - +15.98% EPS beat -17.31% reaction. Tonight's move is setting up the reverse
- Support: $460.55 key (floor) $420.46, $393.28
- Resistance: $491.16 (50 EMA), $505.79 (100 EMA), $530.47 (trendline)
Why Did AMD Fall After Beating Revenue and Raising Q3 Guidance?
AMD reported $4.2 billion in Q2 revenue and $0.14 EPS, a 2.2% beat on expectations with their stock. The consensus for the midpoint of Q3 was set at $12.5 billion, being pushed to $13.0 billion by AMD, with an 8% post-earnings stock drop. There were two primary reasons for the post-earnings drop.
The first reason was AMD's gross margin hitting 54%, compared to the consensus of 56% for the full year.
This gross margin did not help with expanding long term targets. The second reason was the exceedingly bullish pre-earnings performance with a 7.7% runup to $513. AMD seemed priced for a blowout. Since the gross margin has not improved, there was no reason to think the stock would be impacted significantly by earnings, in line with the previous earnings patterns of AMD.
What Is Helios and Why Does Its Margin Matter?
Helios, announced as part of AMD's MI450X GPU rack-scale AI system at their Advancing AI event on July 22 and 23, has gigawatt-scale commitments from Anthropic and Meta. With production expected to begin in Q3 2026 for $5 million to $5.5 million a rack, AMD is well positioned to expand their AI infrastructure with Helios.
High costs of production and maturing GPU yields currently place margin constraints below corporate averages, a problem noted historically by AMD's CFO Jean Hu, and thus the $530.47 trend line holding the pre-earnings rally is expected to remain until Helios margins align with the corporate average.
Bottom Line
For Q2, AMD came in at $11.536 billion in revenue, a 52% increase. They also gave an optimistic consensus-beating Q3 midpoint guidance estimate for $13.0 billion. AMD stock fell 8% after hours, a disappointing result from their optimistic report.
Their 7.7% pre-earnings rally brought the price to $460.55, and keeping it above this price places important recovery targets of $491 and $505, while a loss under this price shifts recovery focus to $420.
Although margins are temporarily compressed due to ramp, the long-term thesis is also bolstered. The 42 Buy ratings, zero Sells, viewing the Helios ramp, and having a 2030 TAM of $120 billion Server CPU positions AMD very well.
Find out more
Comments