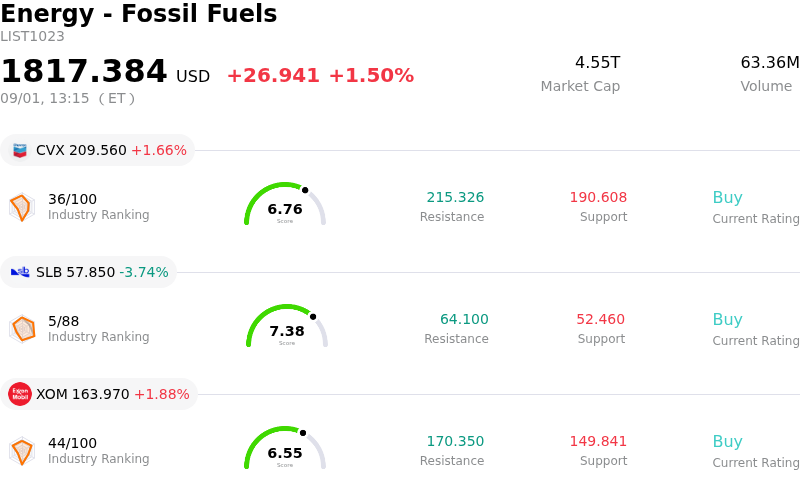
BP PLC (BP) moved up by 3.42%. The Energy - Fossil Fuels sector is up by 1.50%. The company outperformed the industry. Top 3 stocks by turnover in the sector: Chevron Corp (CVX) up 1.65%; Schlumberger NV (SLB) down 3.74%; Exxon Mobil Corp (XOM) up 1.85%.
What is driving BP PLC (BP)’s stock price up today?
BP experienced notable upward momentum driven primarily by a surge in global crude oil prices following escalating geopolitical tensions in the Middle East. Military friction between the United States and Iran near key shipping corridors such as the Strait of Hormuz sparked supply disruption concerns, propelling both Brent crude and West Texas Intermediate benchmark prices sharply higher. As an integrated energy supermajor, BP stands as a direct beneficiary of rising crude prices, which immediately bolster upstream realization rates and short-term cash flow generation expectations.
The firmer commodity environment provides valuable fundamental relief for BP, reinforcing the company's ability to execute its key strategic priorities, including debt reduction, capital allocation discipline, and shareholder distributions. Higher crude realizations ease margin pressure across upstream operational units, offering management expanded financial flexibility. Consequently, institutional investors adjusted their portfolio allocations upward across the energy sector, prioritizing oil and gas majors with strong sensitivity to crude benchmark gains.
Intraday volatility reflected ongoing market debate regarding the sustainability of the crude price rally against a backdrop of broader macroeconomic uncertainty, including elevated bond yields and persistent inflation concerns. While higher benchmark prices improve near-term earnings visibility, volatile commodity markets also heighten investor focus on operational execution, leaving less room for missteps or downstream margin compression. Moving forward, market participants will closely monitor geopolitical developments, production guidance, and the company's progress on balance sheet deleveraging.
Technical Analysis of BP PLC (BP)
Technically, BP PLC (BP) shows a MACD (12,26,9) value of -0.144, indicating a neutral signal. The RSI at 59.273 suggests neutral condition and the Williams %R at 29.301 suggests buy condition. Please monitor closely.
Fundamental Analysis of BP PLC (BP)
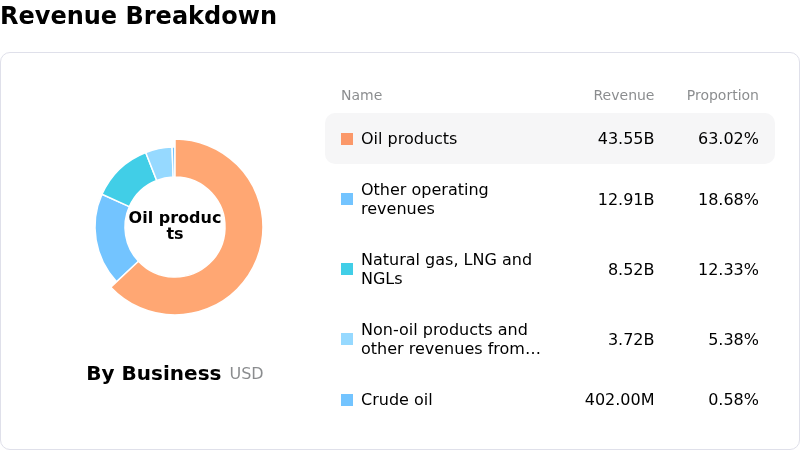
BP PLC (BP) is in the Energy - Fossil Fuels industry. Its latest annual revenue is $189.34B, ranking 3 in the industry. The net profit is $54.00M, ranking 63 in the industry. Company Profile
Over the past month, multiple analysts have rated the company as Buy, with an average price target of $47.95, a high of $64.00, and a low of $35.00.
More details about BP PLC (BP)
Company Specific Risks:
- Governance & Board Leadership Disruptions: Abrupt board and executive turnover following governance and conduct breaches has triggered ongoing shareholder class-action investigations, creating leadership uncertainty and elevating institutional investor concern.
- Capital Allocation Constraints & Share Buyback Pauses: Substantial net debt levels ($22.25 billion) and balance sheet pressure forced the suspension of BP's share buyback program, leaving cash distribution sustainability reliant on aggressive cost-reduction targets of up to $6.5 billion by 2027.
- Strategic Pivot Volatility & Commodity Price Exposure: BP's operational pivot away from renewable energy back toward fossil fuels exacerbates earnings and cash flow sensitivity to rapid downside swings in Brent crude and natural gas benchmark prices.
- Securities Litigation & Disclosure Scrutiny: Ongoing investigations by shareholder rights law firms regarding potential federal securities law violations and regulatory filings continue to weigh on investor sentiment and fuel intraday trading volatility.
Find out more
Comments