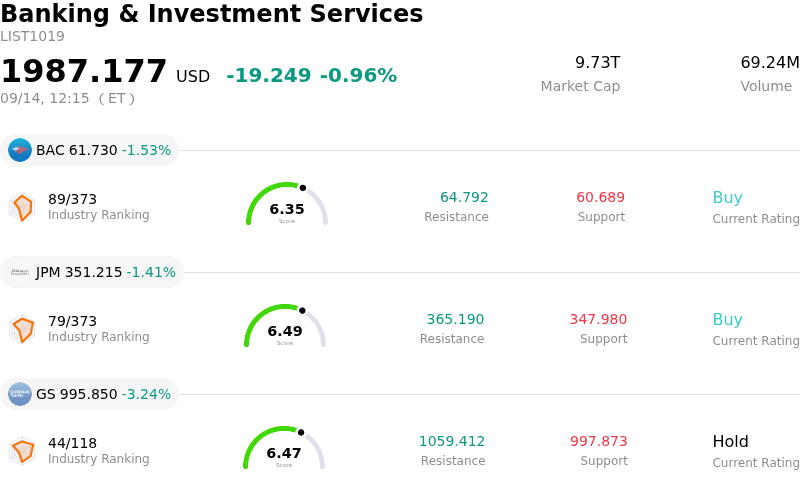
Goldman Sachs Group Inc (GS) moved down by 3.35%. The Banking & Investment Services sector is down by 0.96%. The company underperformed the industry. Top 3 stocks by turnover in the sector: $Bank of America Corp(BAC-N)$ (BAC) down 1.53%; JPMorgan Chase & Co (JPM) down 1.43%; Goldman Sachs Group Inc (GS) down 3.24%.
What is driving Goldman Sachs Group Inc (GS)’s stock price down today?
Goldman Sachs experienced downward pressure and heightened intraday volatility driven primarily by broad macroeconomic shifts and rapidly evolving Federal Reserve rate expectations ahead of the upcoming central bank policy meeting. Hotter-than-anticipated inflation readings, compounded by surging energy prices, prompted several major financial institutions—including Goldman Sachs' own research desk—to revise their monetary policy outlooks in favor of further interest rate tightening. The prospect of prolonged higher borrowing costs and elevated Treasury yields created a risk-off environment that weighed heavily on major financial equities.
As a leading global investment banking and wealth management firm, Goldman Sachs is notably sensitive to capital market conditions and interest rate volatility. The sudden repricing of monetary expectations and rising long-term yields have renewed concerns regarding corporate dealmaking timelines, debt underwriting volumes, and equity capital markets activity. Institutional investors exercised caution, trimming positions in capital-market-sensitive stocks over worries that persistent monetary hawkishness could slow down M&A execution and corporate financing activity.
Sector-wide portfolio adjustments ahead of the central bank decision further amplified intraday price swings. Combined with broader equity market retrenchment and typical mid-September seasonal softness, large-cap banking peers faced widespread selling pressure. While Goldman Sachs remains strategically positioned across its core franchise areas, near-term share performance is currently bound to macroeconomic inflation signals, yield curve adjustments, and shifting institutional risk appetite.
Technical Analysis of Goldman Sachs Group Inc (GS)
Technically, Goldman Sachs Group Inc (GS) shows a MACD (12,26,9) value of -2.627, indicating a sell signal. The RSI at 41.120 suggests neutral condition and the Williams %R at 96.836 suggests oversold condition. Please monitor closely.
Media Coverage of Goldman Sachs Group Inc (GS)
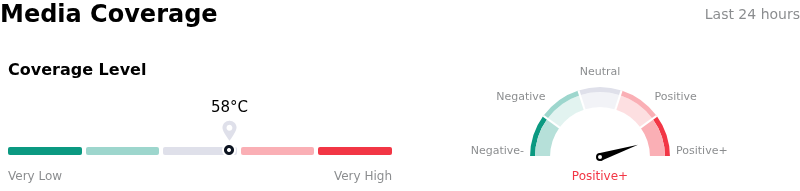
In terms of media coverage, Goldman Sachs Group Inc (GS) shows a coverage score of 58, indicating a moderate level of media attention. The overall market sentiment index is currently in extremely bullish zone.
Fundamental Analysis of Goldman Sachs Group Inc (GS)
Goldman Sachs Group Inc (GS) is in the Banking & Investment Services industry. Its latest annual revenue is $117.10B, ranking 2 in the industry. The net profit is $16.30B, ranking 1 in the industry. Company Profile
Over the past month, multiple analysts have rated the company as Hold, with an average price target of $1174.89, a high of $1325.00, and a low of $995.00.
More details about Goldman Sachs Group Inc (GS)
Company Specific Risks:
- Over-Reliance on Volatility-Driven Trading Revenues: With approximately 60% of net revenues concentrated in Global Banking and Markets activity—driven by macro dislocations and elevated derivatives volumes—the firm faces sharp revenue decay if capital market volatility subsides or trading flows cool.
- Elevated Valuation Multiples Exposing Equity to Sharp Compression: Goldman Sachs trades at a Price-to-Sales ratio near 4.81x (substantially above its historical median of 2.61x) and a premium price-to-book multiple, creating high sensitivity to intraday multiple contraction if earnings momentum slows.
- Institutional Position Trimming and Persistent Insider Net Selling: Analyst tracking reveals mixed institutional confidence, highlighted by major money managers trimming their GS holdings and a sustained pattern of insider selling without corresponding insider purchases over recent quarters.
- High Rate Environment and Debt Capital Markets Execution Headwinds: Climbing Treasury yields and persistent central bank monetary tightness elevate global corporate borrowing costs, threatening to constrain debt underwriting, leveraged finance deals, and corporate advisory completions.
Find out more
Comments