TradingKey - Apple (AAPL) stock has continued to rebound since the fall new product launch event on September 9. Currently hovering around $334, the stock has recovered most of its losses since peaking in late July and is less than 3% away from its all-time high of $344.26.
The market is pinning its hopes for breaking previous highs on sales of this round of new products. Global delivery times for the iPhone 18 Pro and 18 Pro Max tracked by JPMorgan have expanded more than during the same period last year, and Evercore ISI's consumer survey also points to a better-than-expected replacement cycle.
Meanwhile, delivery times in the Chinese market remain significantly shorter than last year, which JPMorgan considers a major concern in tracking current demand.
Delivery Lead Time Expansion Exceeds Same Period Last Year, but China Market Demand Is Main Concern
JPMorgan analyst Samik Chatterjee believes that shorter first-week delivery lead times reflect initial stock allocations being concentrated toward high-end models rather than a signal of weak demand, with the subsequent extension of lead times aligning with the pace of demand absorbing inventory.
According to JPMorgan data, delivery lead times for the iPhone 18 Pro and 18 Pro Max expanded by 12 days and 7 days, respectively, in the four days following the first day of pre-orders, significantly exceeding the 5-day and 2-day expansions for the iPhone 17 Pro and 17 Pro Max during the same period last year. In absolute terms, as of the mid-week check on September 16, global average home delivery lead times for the 18 Pro and 18 Pro Max stood at 19 days and 26 days, respectively, compared with 20 days and 26 days for the 17 Pro and 17 Pro Max in the prior-year period, putting them roughly on par. Additionally, the notable divergence in delivery lead times across different color variants seen during early pre-orders has largely disappeared.
As of the mid-week check, all colors across every market tracked by JPMorgan were reporting identical delivery windows. In the U.S. market, delivery lead times for the 18 Pro and 18 Pro Max were 17 days and 24 days, respectively, up from 2 days and 22 days on the first day of pre-orders, and slightly above the 16 days and 23 days recorded for the 17 Pro and 17 Pro Max in the same period last year; the U.S. accounts for approximately 34% of global iPhone shipments.
The Chinese market currently shows the most significant year-over-year gap among all tracked regions. As of September 16, delivery lead times for the 18 Pro and 18 Pro Max in China were 25 days and 29 days, respectively; although expanded from 13 days and 21 days on the first day of pre-orders, they remain noticeably below the 32 days recorded for both the 17 Pro and 17 Pro Max in the same period last year. Regarding in-store pickup, neither the 18 Pro nor the 18 Pro Max is available for store pickup in China. China accounts for approximately 19% of global iPhone shipments.
JPMorgan noted that while the year-over-year gap in China narrowed compared to the first week, it remains a primary concern in current demand tracking.
iPhone Upgrade Cycle Beats Expectations, FY2027 Revenue Poised to Top Estimates
Evercore ISI's latest consumer survey results show that the iPhone upgrade cycle is performing stronger than expected, with pricing strategy expected to provide a substantial tailwind. The firm's annual survey of nearly 4,000 consumers revealed that, driven by the latest models, the iPhone replacement cycle is "performing better than expected."
In addition to strong volume performance, Evercore noted that overall iPhone pricing is expected to rise by more than 20%, driven by higher prices, increased demand for high-end models, and a consumer preference for larger storage configurations. The report noted that "Pro Max remains king," with 53% of respondents planning to purchase an iPhone 18 Pro or Pro Max, including 32% specifically intending to buy the Pro Max, up from 29% last year. As for the new foldable iPhone Duo, demand is currently relatively modest, with only 14% of respondents expressing interest in buying it, though Evercore expects demand to gradually recover following its official mid-October release.
The survey indicates that device aging is the main driver of upgrades, with 67% of respondents stating they are considering an upgrade because their current iPhone is too old, a sharp rise from 48% last year. As consumers increasingly prefer higher storage capacity models, along with Apple introducing 2TB versions for the Pro and Duo series, Evercore expects the average selling price of the iPhone to rise by approximately 28%.
Overall, Evercore noted that overall demand appears slightly better than the same period last year, suggesting that Apple's revenue for fiscal year 2027 could exceed the consensus market expectation of around 7% growth.
Apple Technical Analysis
Apple's stock price has resumed moving upward along moving averages since September, with the current price regaining the 0.236 Fibonacci retracement level ($327.85) and staying close to the 5-day moving average ($335.08) and 10-day moving average ($334.31). The short-term structure represents a 'high-level consolidation before a second push toward the previous high,' with a breakout above $344 not yet confirmed.
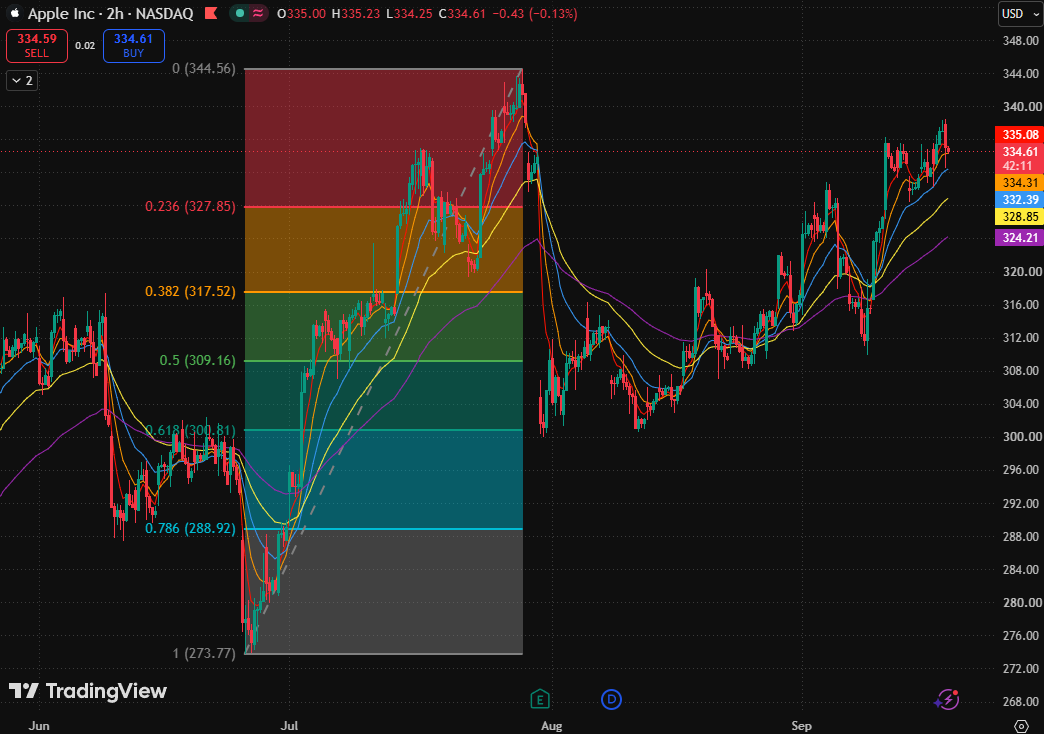
Apple 2-hour stock price chart, Source: TradingView
Regarding moving averages, the stock price sits between the 5-day and 10-day moving averages. Short-term moving averages have flattened and begun to converge, indicating that upward momentum has shifted from the steep rally in mid-September to consolidation at elevated levels. As long as the price stays above the 10-day moving average ($334.31) and 20-day moving average ($332.39), the trend remains bullish; once these two short-term moving averages are broken consecutively, the consolidation will turn into a retracement.
Currently, the first support level is at the 10-day moving average ($334.31). If the stock pulls back without falling below this level, it can still be viewed as building momentum after testing the short-term moving average. The second support is the 20-day moving average ($332.39), which serves as the dividing line for whether the short-term bullish alignment can be maintained. If $334.31 fails to hold, the pull-back will first test this level; holding it means an ongoing upward continuation, while breaking it will mark the beginning of the breakdown of the short-term bullish alignment.
Overhead resistance is clear: first crossing the 5-day moving average ($335.08), and then challenging the previous high ($344). Only a firm closing above $344 will upgrade this rally from a price recovery to a breakout to a new high.
Notably, initial sales data for the iPhone 18 Pro, delivery lead-time readings, and October foldable phone pre-orders will continue to influence pricing around this range.
Find out more
Comments