In 2026, TradFi and crypto are entering a period of deeper convergence. Traditional financial assets and crypto markets are increasingly moving in tandem, tokenized equities and crypto-native assets are being traded on the same exchanges, while traditional capital continues to flow into the digital asset market through ETFs and stablecoins.
Against this backdrop of increasingly complex interactions across markets, asset classes and blockchains, single-dimensional dashboards are no longer sufficient for investors trying to make informed decisions.
RootData’s redesigned homepage officially launches today. This is more than a UI refresh—it represents a structural shift from fragmented data discovery toward a more comprehensive market view. By bringing together key indicators across TradFi and crypto on a single page, the new homepage allows users to see the broader market at a glance while moving seamlessly from macro-level trends to individual assets.
1. Breaking Down the Data Barriers Between TradFi and Crypto
With the latest upgrade, RootData breaks down the traditional data silos separating conventional financial markets from crypto.
Nine core modules that were previously scattered across different platforms and workflows are now integrated into a single homepage: Market Overview, Capital Flows, Stablecoin Liquidity, Platform Market Share, Trending Assets, Blockchain Market Overview, Protocol Revenue, TradFi Trading Activity and RootData Research. Together, these modules cover a broad spectrum of market data, ranging from macro market conditions and capital flows to cross-market asset discovery, exchange liquidity distribution, blockchain ecosystems and project fundamentals.
The goal is to address several major challenges facing investors in an increasingly integrated TradFi-crypto market: fragmented information, difficulty comparing assets across markets and limited visibility into capital flows.By consolidating these datasets, RootData enables users to track assets more efficiently across both traditional and crypto markets.
2. What changed
2.1 Market Overview and Capital Flows: read the cycle through smart money
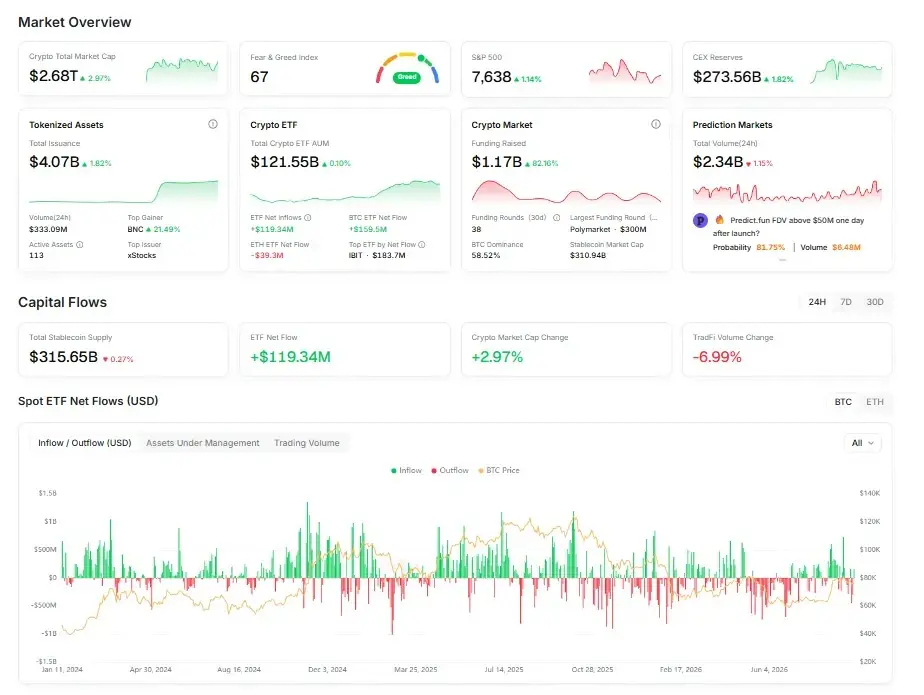
The Market Overview block now groups indicators that are usually checked in different places: total crypto market cap, the Crypto Fear & Greed Index, the Dow Jones Industrial Average, CEX derivatives volume, crypto ETF inflows and outflows, the size of the tokenized asset market, and crypto fundraising.For most users, those prints are more useful as a cycle and sentiment dashboard than as standalone stats.
The Capital Flows module sits next to them. It tracks ETF net flows, changes in stablecoin supply, and a ranking of the largest contributors to those moves. That is the “smart money” layer: whether traditional capital is coming in, and which parts of crypto liquidity are attracting or losing funds. The intended use is straightforward. Instead of chasing price alone, users can see where money is coming from and where it is going, and use that to judge turning points with more than a chart.
2.2 Stablecoins and the Platform Competitive Landscape: Seeing Through Real Purchasing Power and the Platform Strength Map
Going deep into the underlying layers of the ecosystem, the granularity of the data is further refined. This section directly addresses users’ challenges in selecting products and choosing exchanges in their daily transactions.
Multi-Dimensional Stablecoin Analysis: Tracking the Market’s Real Liquidity
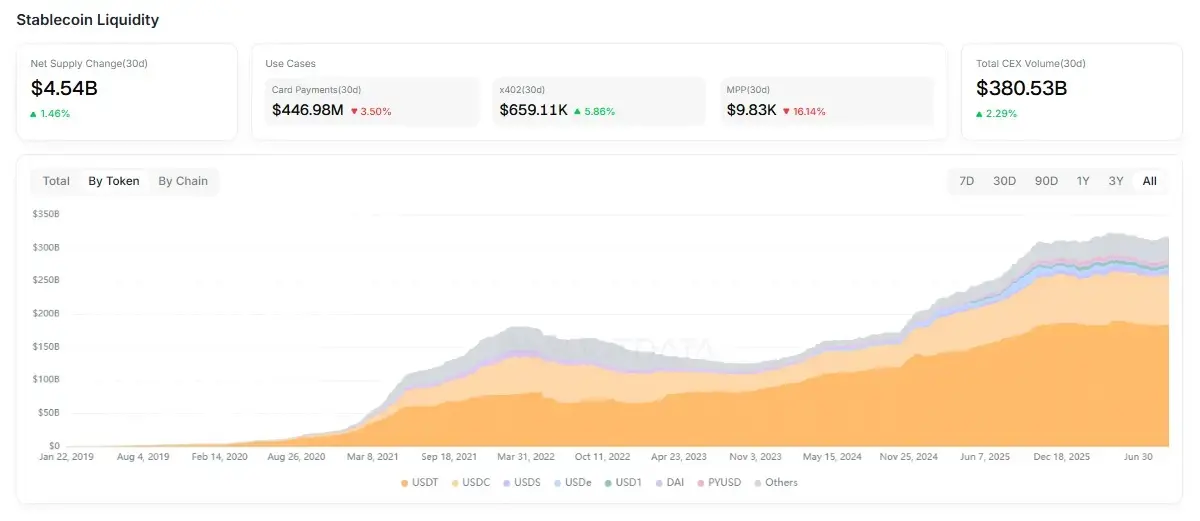
Stablecoins effectively serve as the market’s liquidity reserve, and changes in stablecoin supply can offer insight into potential shifts in market activity. The new homepage’s Stablecoin Liquidity module allows users to switch between three views: total market supply, individual stablecoins and blockchain networks. It also combines 30-day net supply changes with payment application data and CEX trading volume.
For users, this provides a clearer view of where liquidity is moving across the crypto ecosystem. By tracking net stablecoin growth across different blockchains alongside payment activity, users can identify which ecosystems are attracting new capital. CEX trading volume can then provide an additional signal as to whether that liquidity is translating into actual trading activity.
Platform Market Share: Comparing Exchange Strength Across TradFi and Prediction Markets
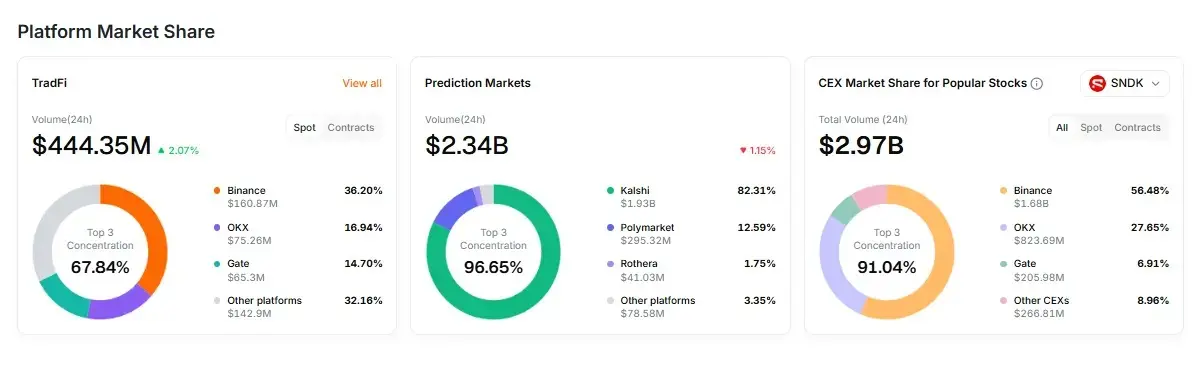
The Platform Market Share module uses intuitive donut charts to show market share and concentration across TradFi spot markets, derivatives, prediction markets and popular equities. Users can also access full rankings for TradFi-focused platforms. For traders, this provides a practical way to evaluate where liquidity and trading activity are concentrated.
The market-share data makes it easier to identify which exchanges have stronger positions in TradFi assets or prediction markets, helping users assess where liquidity and market depth may be strongest and potentially reduce unnecessary slippage caused by thin markets.
2.3 Trending Assets: Finding Alpha Across Markets
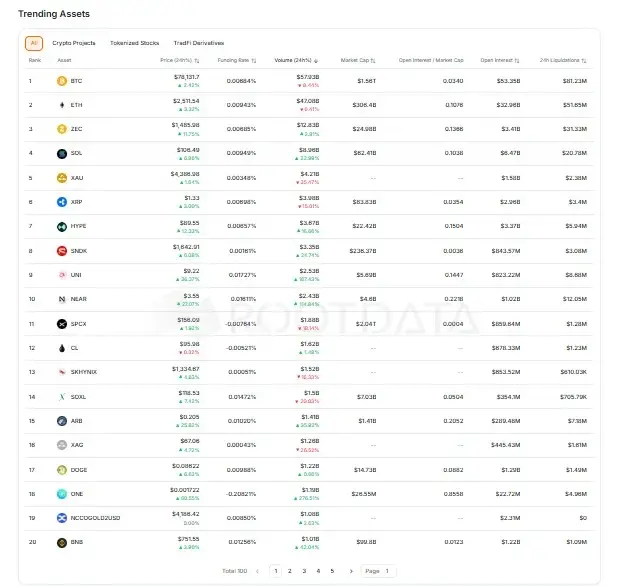
At the asset-discovery level, RootData has introduced a new Trending Assets list. Rather than presenting only crypto tokens, the list brings together both crypto-native assets and TradFi-related assets in one interface. Users can filter by category and sort across multiple metrics, while also tracking both launched and pre-launch projects. This allows users to discover trending assets across markets from a single destination.
More importantly, it removes the traditional separation between crypto-native and conventional financial assets, making cross-market comparisons easier. Users can quickly compare the performance of different types of assets and use those insights to support their own asset-selection and trading decisions.
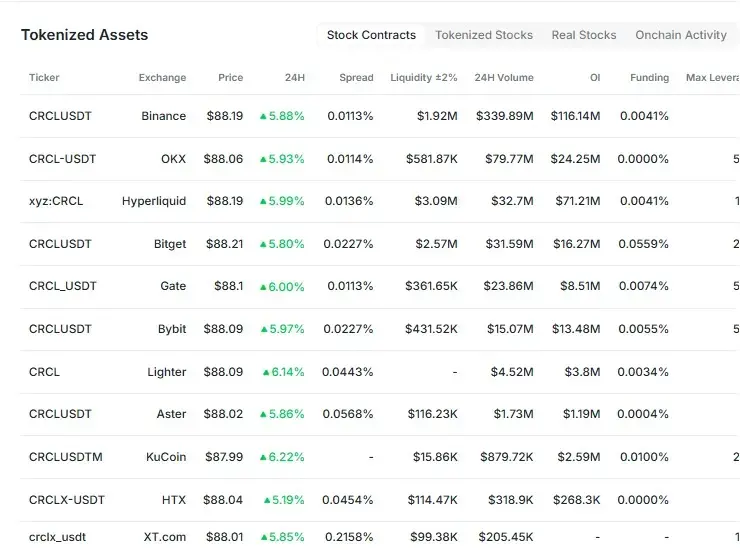
For individual popular tokenized equities, users can also compare how those assets perform across different exchanges in both spot and derivatives markets. This addresses a common challenge for traders: identifying the venues with the strongest liquidity. Spot-market share can help indicate where natural buying and selling activity is most concentrated, while derivatives market share can highlight where futures and perpetual markets have the deepest trading activity.
For users developing trading strategies or looking for lower-slippage execution, this provides a clearer way to identify the most active markets for a particular asset.
2.4 Chains and protocol revenue: look past price
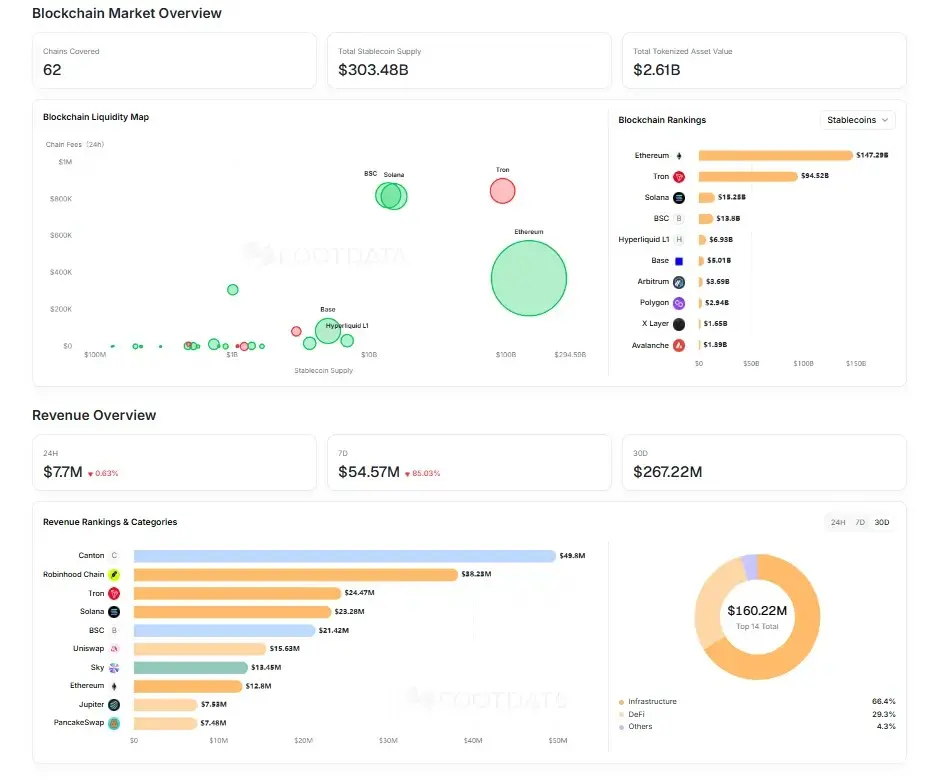
After flows, venues and trending names, the next question is whether the networks underneath those assets are doing real work.RootData’s chain data does not stop at headline TVL.
Users can compare ecosystems on project count, fundraising, stablecoin supply, tokenized assets, onchain fees and active addresses. Read together, those prints help show which chains are attracting builders, users and capital.Protocol Revenue adds a fundamentals screen. It ranks protocols by revenue over different windows and maps those figures to protocol category and chain.
The point is to look through sentiment and see whether a protocol is generating revenue — the cash-flow test behind the asset.
2.5 Market Activity and Research: From Spotting Moves to Understanding the Story Behind Them
The homepage also tracks developments at the intersection of traditional finance and crypto markets.The TradFi Trading Activity section provides updates on changes in prices, trading activity and other market indicators, helping users identify shifts in market behavior as they happen.
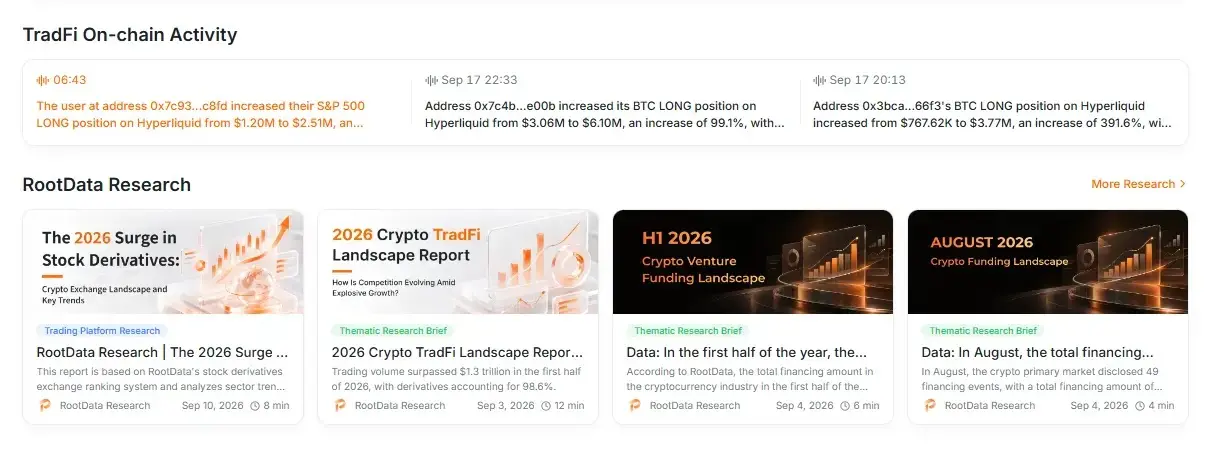
RootData Research, meanwhile, regularly publishes in-depth reports covering areas such as the equity derivatives market and crypto fundraising.
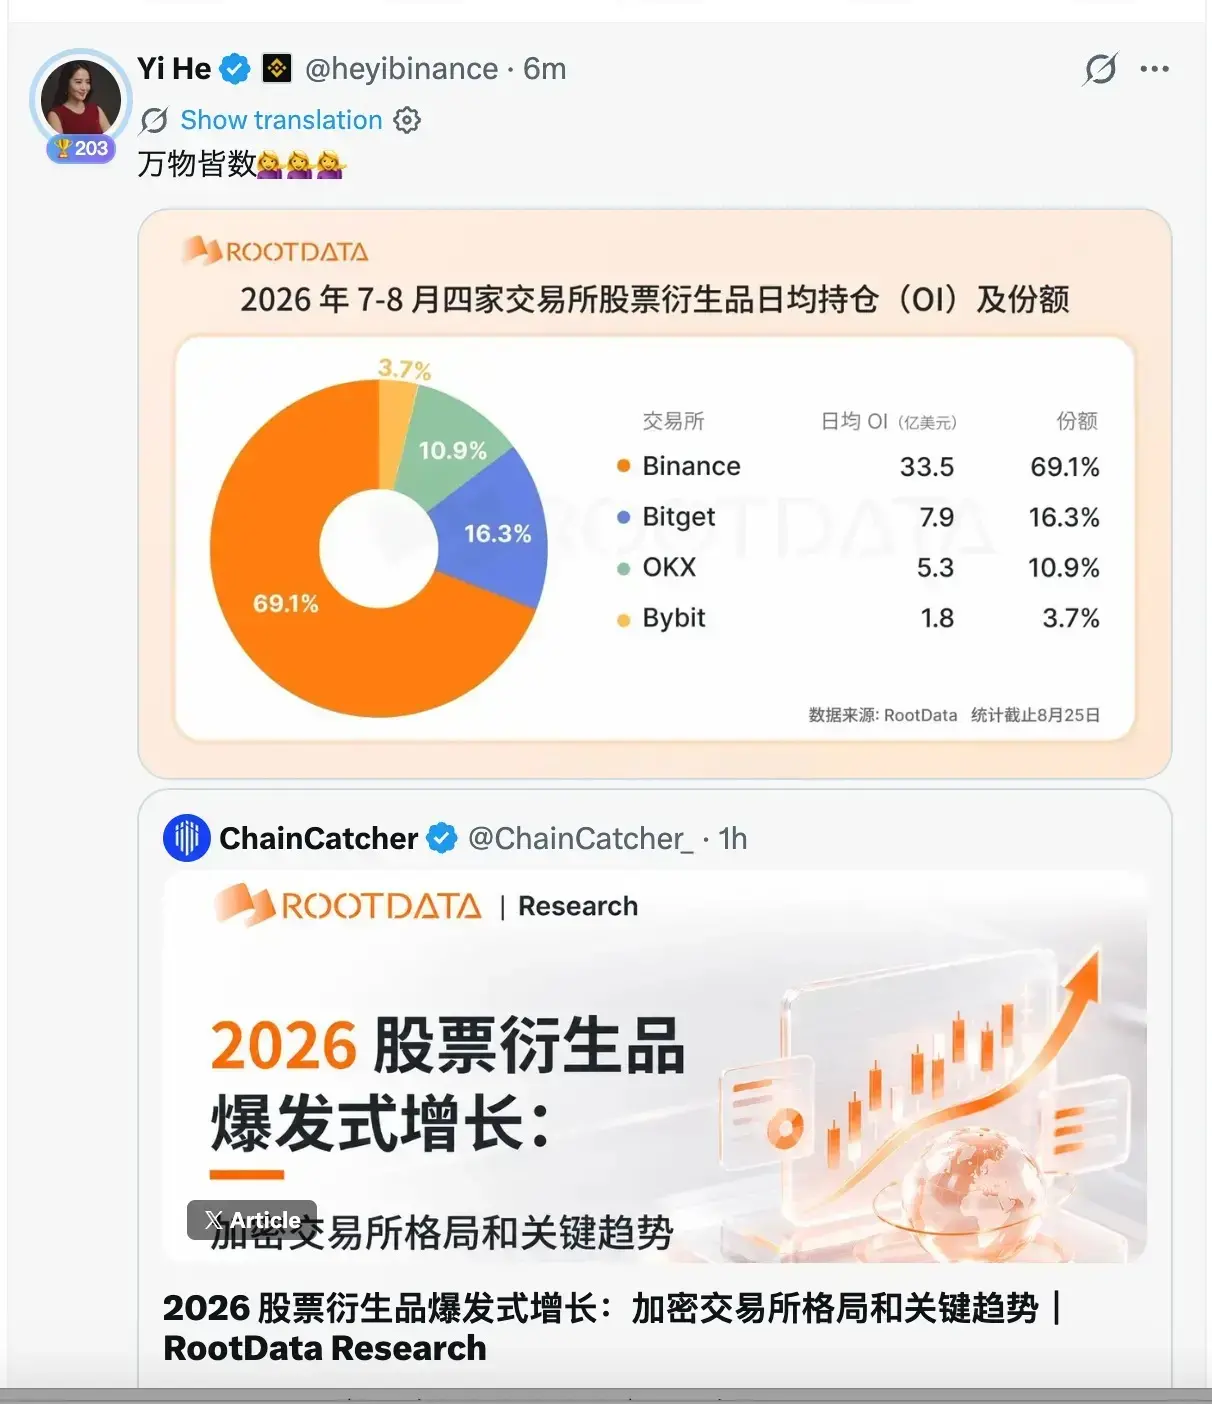
Its research has been shared and recognized by prominent industry figures, including Binance co-founder Yi He, and has developed a strong presence within the crypto industry.
By connecting market data with deeper research, users can move from identifying unusual activity to understanding the assets, market structure and broader context behind those moves.The result is a more complete research workflow: see the data, understand the logic and make informed decisions.
Conclusion
The homepage redesign sits on work RootData had already shipped. The Tokenized Assets section and Stock Business Rankings were built first, and they remain the base layer for cross-market research.
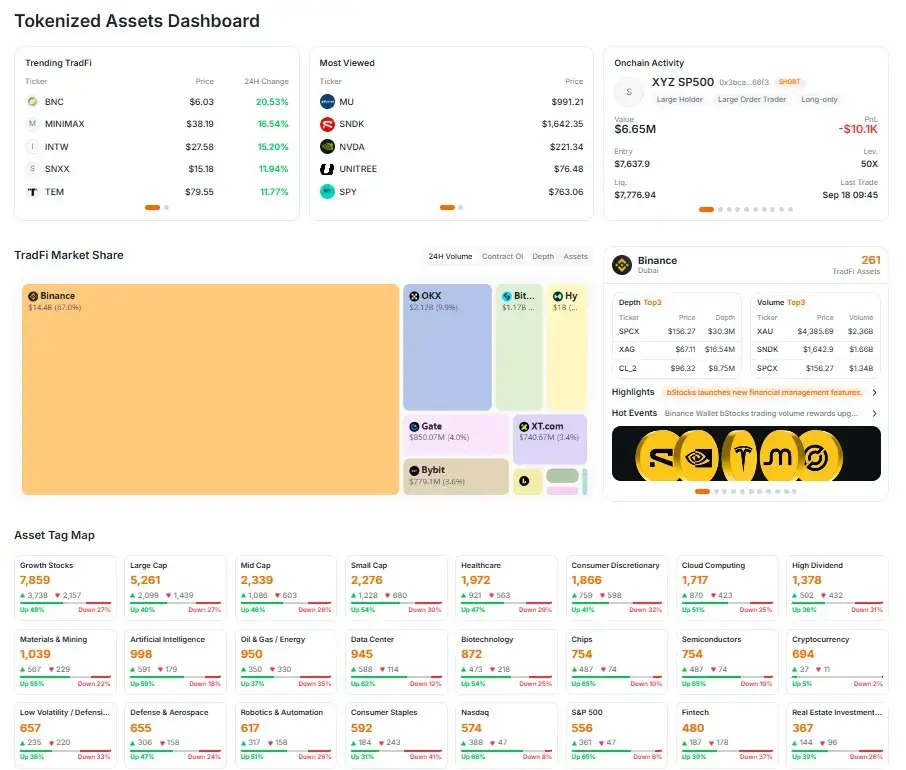
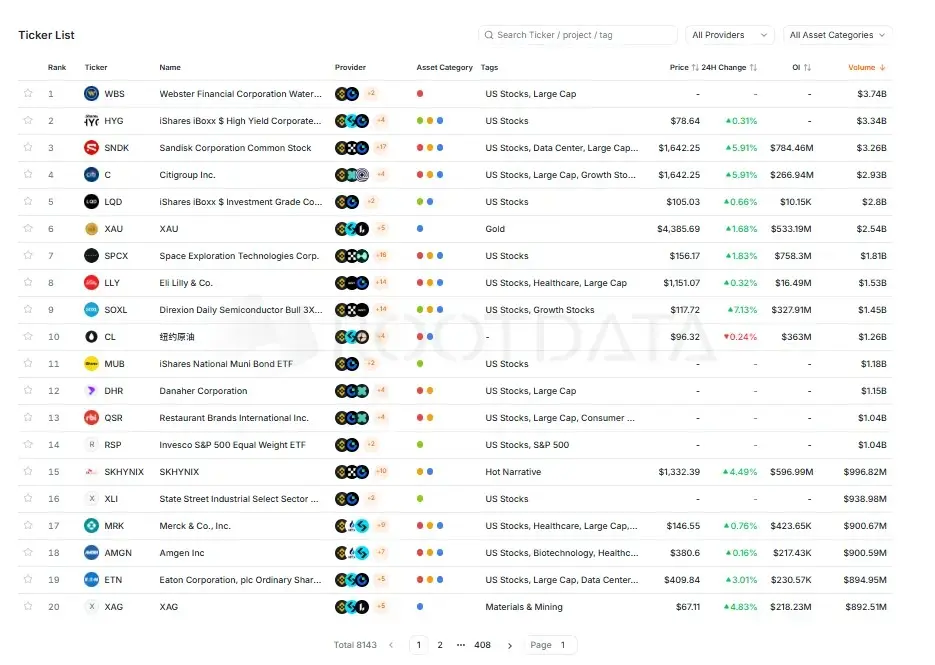
Tokenized Assets is available from the top navigation and tracks the tokenized market as it develops. Stock Business Rankings go one level deeper, showing how traditional financial names trade in spot and derivatives on major crypto exchanges.
Those datasets are there to show how traditional brokers and crypto venues are competing and cooperating as the two markets overlap.
As the line between TradFi and crypto thins, the value of a data product is whether it connects those markets and makes the important prints visible. RootData’s redesigned homepage brings complex cross-market information into a unified interface, offering users a comprehensive gateway to research in an increasingly integrated financial landscape.
Visit RootData today to explore the new homepage and experience a more efficient way to research markets across TradFi and crypto.
Comments