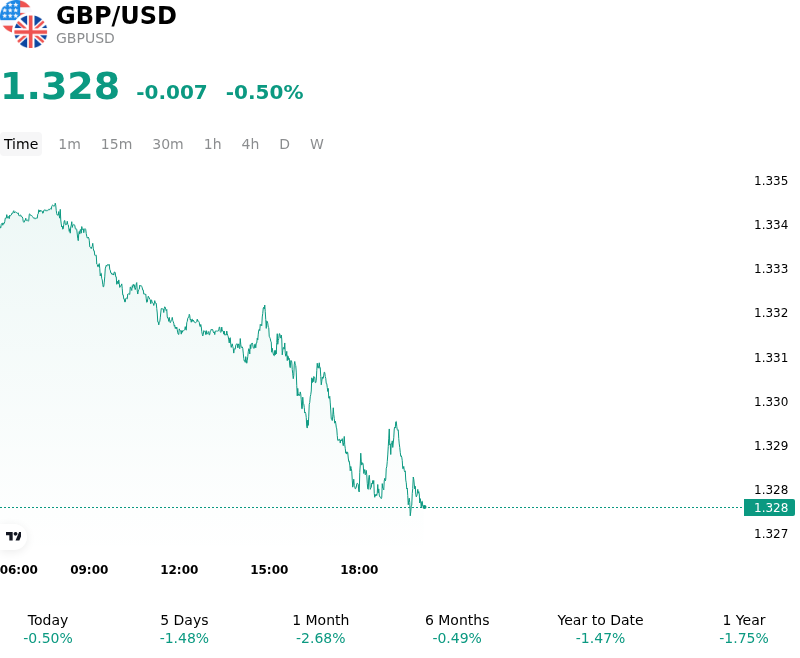
GBP/USD (GBPUSD) is down 0.50% at Sep 23 08:10(ET), now at $1.32755, with a 7-day down of 0.73%.
What is driving GBP/USD (GBPUSD)’s stock price down today?
The decline in the GBP/USD exchange rate was primarily driven by weaker-than-expected UK economic survey data alongside widening monetary policy divergence between the Federal Reserve and the Bank of England. Preliminary Purchasing Managers' Index data for the UK highlighted a noticeable deceleration in private sector business activity, led by a slowdown in the vital service sector. The survey pointed to sluggish underlying economic growth, dampening market sentiment toward Sterling even as accelerating input costs presented a challenging stagflationary backdrop for domestic policymakers.
Monetary policy differentials continued to exert downward pressure on the currency pair following recent central bank decisions. While the Federal Reserve initiated a quarter-point rate hike to raise the federal funds target range to 3.75%-4.00% and signaled potential further tightening to combat persistent inflation, the Bank of England opted to maintain its benchmark Bank Rate at 3.75%. This divergence in interest rate paths eroded Sterling's yield advantage over the US Dollar, encouraging institutional capital to realign toward Dollar-denominated assets.
The strength in the US Dollar was further supported by broader economic resilience in the United States. US business survey indicators confirmed solid expansionary momentum, reinforcing expectations of sustained US economic exceptionalism relative to its European peers. In addition, ongoing geopolitical tensions in the Middle East and elevated global energy prices maintained an underlying bid for the greenback as a safe-haven asset while raising concerns over energy import costs for the British economy.
From a technical perspective, the break below key support levels around 1.3340 and the 200-day moving average accelerated short-term selling momentum. The technical breach triggered systematic stop-loss orders and prompted institutional traders to adjust positioning, extending the currency pair's decline toward multi-month lows. In the near term, investors will monitor upcoming official growth data, energy price trends, and central bank communications to gauge whether the divergence in monetary policy expectations will persist.
Technical Analysis of GBP/USD (GBPUSD)
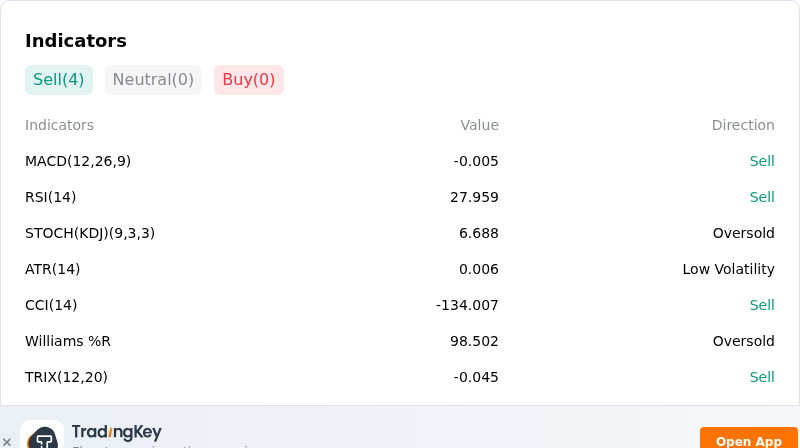
Technically, GBP/USD (GBPUSD) shows a MACD (12,26,9) value of -0.005, indicating a sell signal. The RSI at 27.959 suggests sell condition and the Williams %R at 98.502 suggests oversold condition. Please monitor closely.
More details about GBP/USD (GBPUSD)
Recent Events and Risks:
- Monetary Policy Spread and Hawkish Fed Guidance: Following the Federal Reserve's rate increase to 3.75%–4.00% while the Bank of England maintained its policy rate at 3.75%, the US Dollar has reclaimed an interest rate advantage over Sterling. Recent hawkish signals from Fed officials pushing for further monetary tightening continue to cap GBP/USD rallies below 1.3400, maintaining downside pressure on the pair.
- UK Fiscal Deterioration and Borrowing Surge: Official UK statistics showing public sector net borrowing surged to £18.26 billion in August—substantially above the £15.70 billion forecast—have reignited market concerns surrounding government debt sustainability and fiscal trajectory, directly undermining Sterling sentiment.
- Diverging Rate Expectations and Weak Labour Metrics: Recent UK employment weakness, including falling payrolls and cooling wage growth, has led institutional analysts to warn that market-priced BoE rate hike expectations are unsustainable, creating repricing risks for GBP/USD if the central bank stays on hold.
- Technical Breakdown Below Key Support: GBP/USD has broken below pivotal short-term support around 1.3340, falling beneath its 50-period moving average amid weakening momentum indicators. This technical breakdown leaves the currency pair exposed to accelerated selling toward lower support levels around 1.3200.
Find out more
Comments