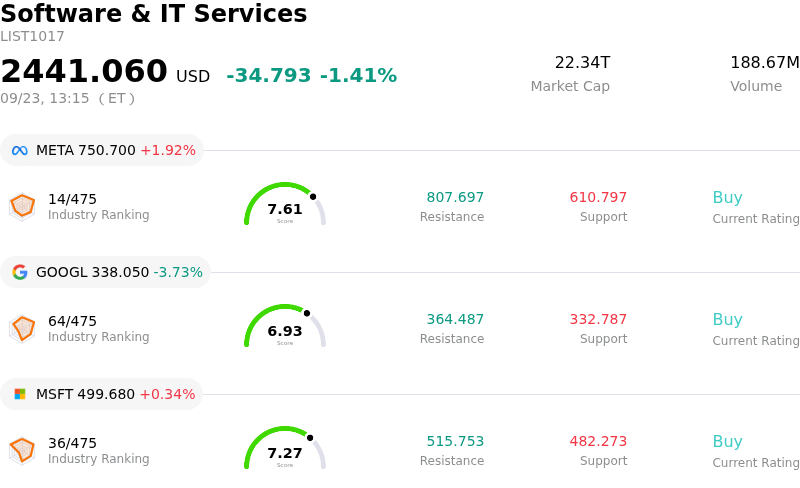
Alphabet Inc Class A (GOOGL) moved down by 3.73%. The Software & IT Services sector is down by 1.41%. The company underperformed the industry. Top 3 stocks by turnover in the sector: Meta Platforms Inc (META) up 1.99%; Alphabet Inc Class A (GOOGL) down 3.73%; Microsoft Corp (MSFT) up 0.34%.
What is driving Alphabet Inc Class A (GOOGL)’s stock price down today?
Alphabet experienced notable downward pressure as shares failed to hold above critical technical resistance levels, prompting short-term profit taking and risk reduction. A primary driver behind the decline is growing investor skepticism over massive capital expenditure commitments tied to artificial intelligence infrastructure and data center expansion. While the enterprise-wide integration of Gemini models continues to boost platform capabilities and cloud segment momentum, market participants remain cautious regarding the delayed timeline for tangible return on investment and potential pressure on cash flow generation.
Compounding the sell-off is the persistent overhang of regulatory and legal headwinds. Recent regulatory actions in Europe, including substantial fines related to user data protection, have reignited concerns surrounding international compliance costs and operational restrictions. Furthermore, ongoing antitrust scrutiny in key markets regarding core search distribution agreements and digital advertising practices continues to cap valuation multiples, keeping institutional buyers cautious ahead of further legal developments.
Broader market dynamics and institutional portfolio reallocation also contributed to the intraday retreat. Rising yield pressures and a wider risk-averse tone across mega-cap technology equities led portfolio managers to trim exposure. Despite solid underlying fundamentals in digital advertising and cloud computing, short-term market attention remains fixed on capital discipline and macro uncertainty, driving the stock lower for the session.
Technical Analysis of Alphabet Inc Class A (GOOGL)
Technically, Alphabet Inc Class A (GOOGL) shows a MACD (12,26,9) value of 1.984, indicating a neutral signal. The RSI at 45.243 suggests neutral condition and the Williams %R at 71.740 suggests sell condition. Please monitor closely.
Media Coverage of Alphabet Inc Class A (GOOGL)
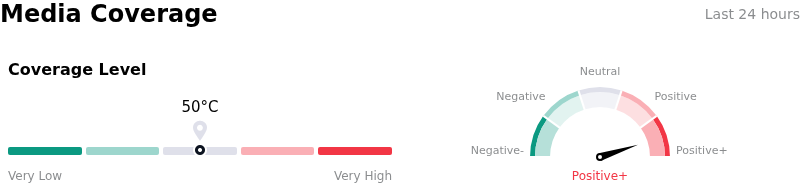
In terms of media coverage, Alphabet Inc Class A (GOOGL) shows a coverage score of 50, indicating a moderate level of media attention. The overall market sentiment index is currently in extremely bullish zone.
Fundamental Analysis of Alphabet Inc Class A (GOOGL)
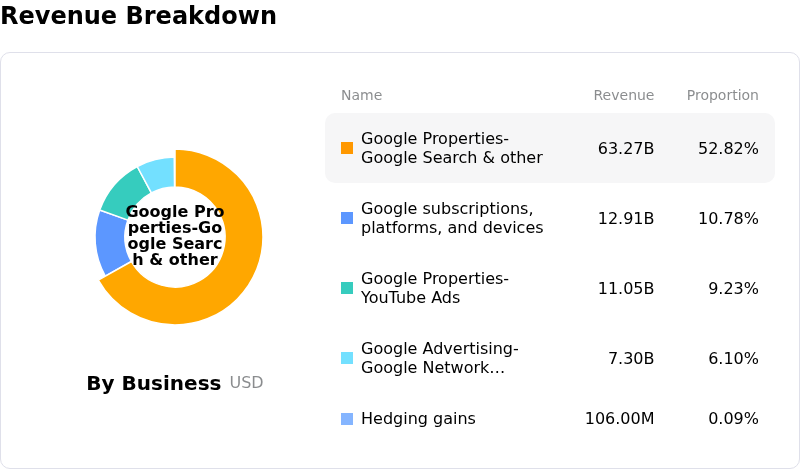
Alphabet Inc Class A (GOOGL) is in the Software & IT Services industry. Its latest annual revenue is $402.84B, ranking 2 in the industry. The net profit is $132.17B, ranking 2 in the industry. Company Profile
Over the past month, multiple analysts have rated the company as Buy, with an average price target of $426.55, a high of $515.00, and a low of $315.00.
More details about Alphabet Inc Class A (GOOGL)
Company Specific Risks:
- Surging AI CapEx and Margin Compression: Alphabet's accelerated rollout of Gemini across desktop and enterprise platforms is driving massive infrastructure investments, intensifying institutional concerns over high capital expenditures and near-term margin pressure.
- Competitive Disintermediation from Rival AI Agents: The rapid adoption of Meta's "Muse" AI assistant, which interfaces directly with Gmail, Google Docs, and Calendar without displaying advertisements, threatens to bypass Google's core ecosystem and weaken search-based advertising revenue.
- Emergence of AI-Focused Antitrust Lawsuits: Alphabet was named as a defendant in a new antitrust lawsuit targeting its artificial intelligence business practices, reintroducing legal uncertainty and regulatory overhangs to the stock.
- Technical Reversal and Resistance Level Rejection: Intraday trading pressure intensified as GOOGL shares failed to hold above the $360 technical resistance mark, triggering sell-side volume and short-term profit-taking across tech portfolios.
Find out more
Comments