TradingKey - On September 25, Eastern Time, Microsoft (MSFT) unveiled a new generation of Microsoft Copilot and announced three features: Home, Code, and Autopilot. Autopilot can execute long-running tasks in the cloud and continue working after users go offline, further expanding Copilot's application scope in enterprise automation.
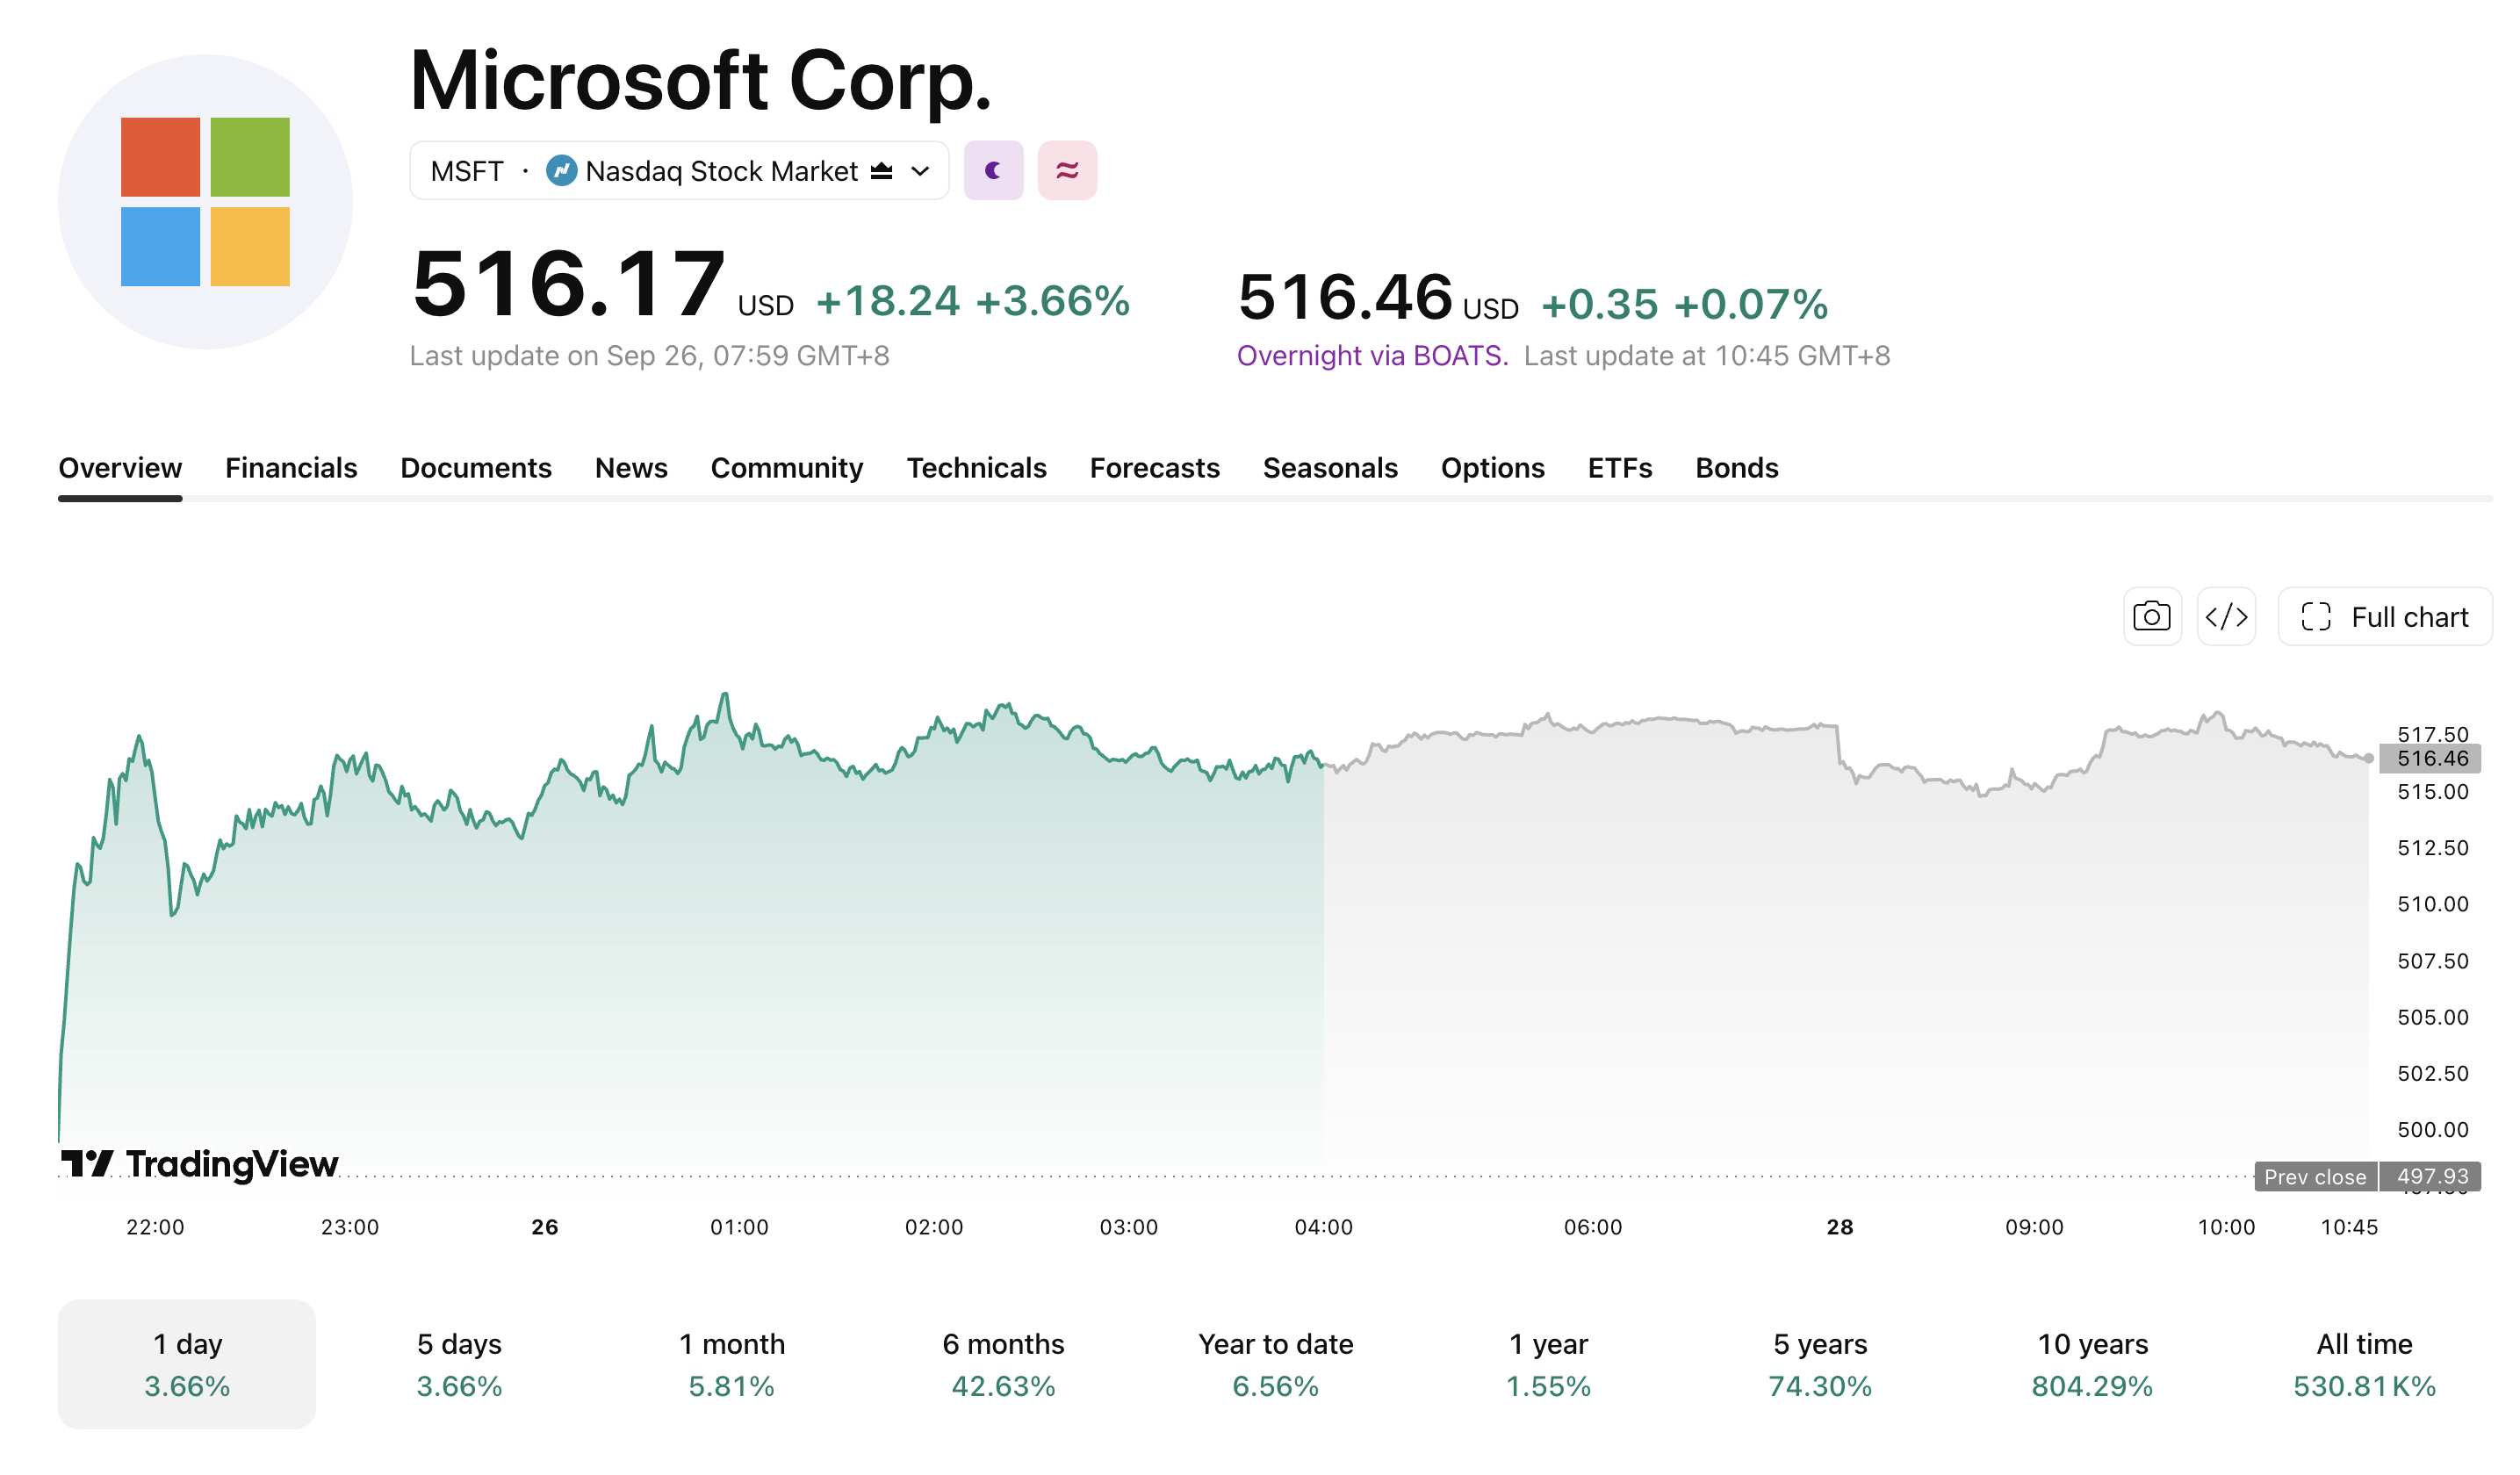
Microsoft shares rose 3.66% on the day, closing at $516.17 and reaching an intraday high of $519.38. The Copilot upgrade released that day attracted market attention.
[Source: TradingView]
How Autopilot Executes Long-Duration Tasks
The new version of Copilot adds three features: Home, Code, and Autopilot. Home integrates Chat and Cowork to serve as a unified work entry point; Office in Copilot connects Word, Excel, and PowerPoint to Copilot; Code uses the same underlying technology as GitHub Copilot, enabling users to create applications, dashboards, and automated workflows using natural language.
Autopilot is a personalized AI agent capable of proactively advancing long-running tasks. Users can set its name, role, goals, and execution boundaries. Autopilot can monitor work channels, track project progress, handle routine tasks, and resume prior projects days later. Built on a cloud-hosted architecture, it features an independent identity, memory, compute environment, and workspace, while remaining subject to enterprise permissions, auditing, and governance rules.
Home and Code will be gradually rolled out over the coming weeks through the Frontier program, while Autopilot is expected to expand its private preview in late September.
Can Pay-As-You-Go Copilot Boost Microsoft Revenue?
Microsoft will adopt usage-based pricing for Cowork, Code, Autopilot, and other long-running agent features. In addition to purchasing user seats, enterprises can pay fees based on model choice and actual usage.
This model adds a revenue stream for Copilot beyond seat subscriptions. As enterprises apply these features to vendor reviews, financial closes, sales materials, and project management, Copilot revenue will be impacted by paid seats, usage scale, and specific rates.
Microsoft's fourth-quarter revenue for fiscal year 2026 was $90.007 billion, up 18% year-over-year; Microsoft Cloud revenue grew 27% to $59.3 billion, and Azure and other cloud services revenue rose 43%.
Microsoft 365 Copilot paid seats exceeded 30 million, and Azure's full-year revenue surpassed $100 billion for the first time.
In the fourth fiscal quarter, Microsoft Cloud's gross margin fell to 65% from 68% in the same period last year, mainly impacted by a business shift toward Azure, AI infrastructure spending, and growth in product usage.
If Autopilot usage expands, costs for model inference, storage, and compute will also increase. Whether usage-based revenue can cover these related costs will impact the profit contribution of the Copilot business.
MSFT Stock Technical Analysis: Targets $566 After Breaking $520
[Source: TradingView]
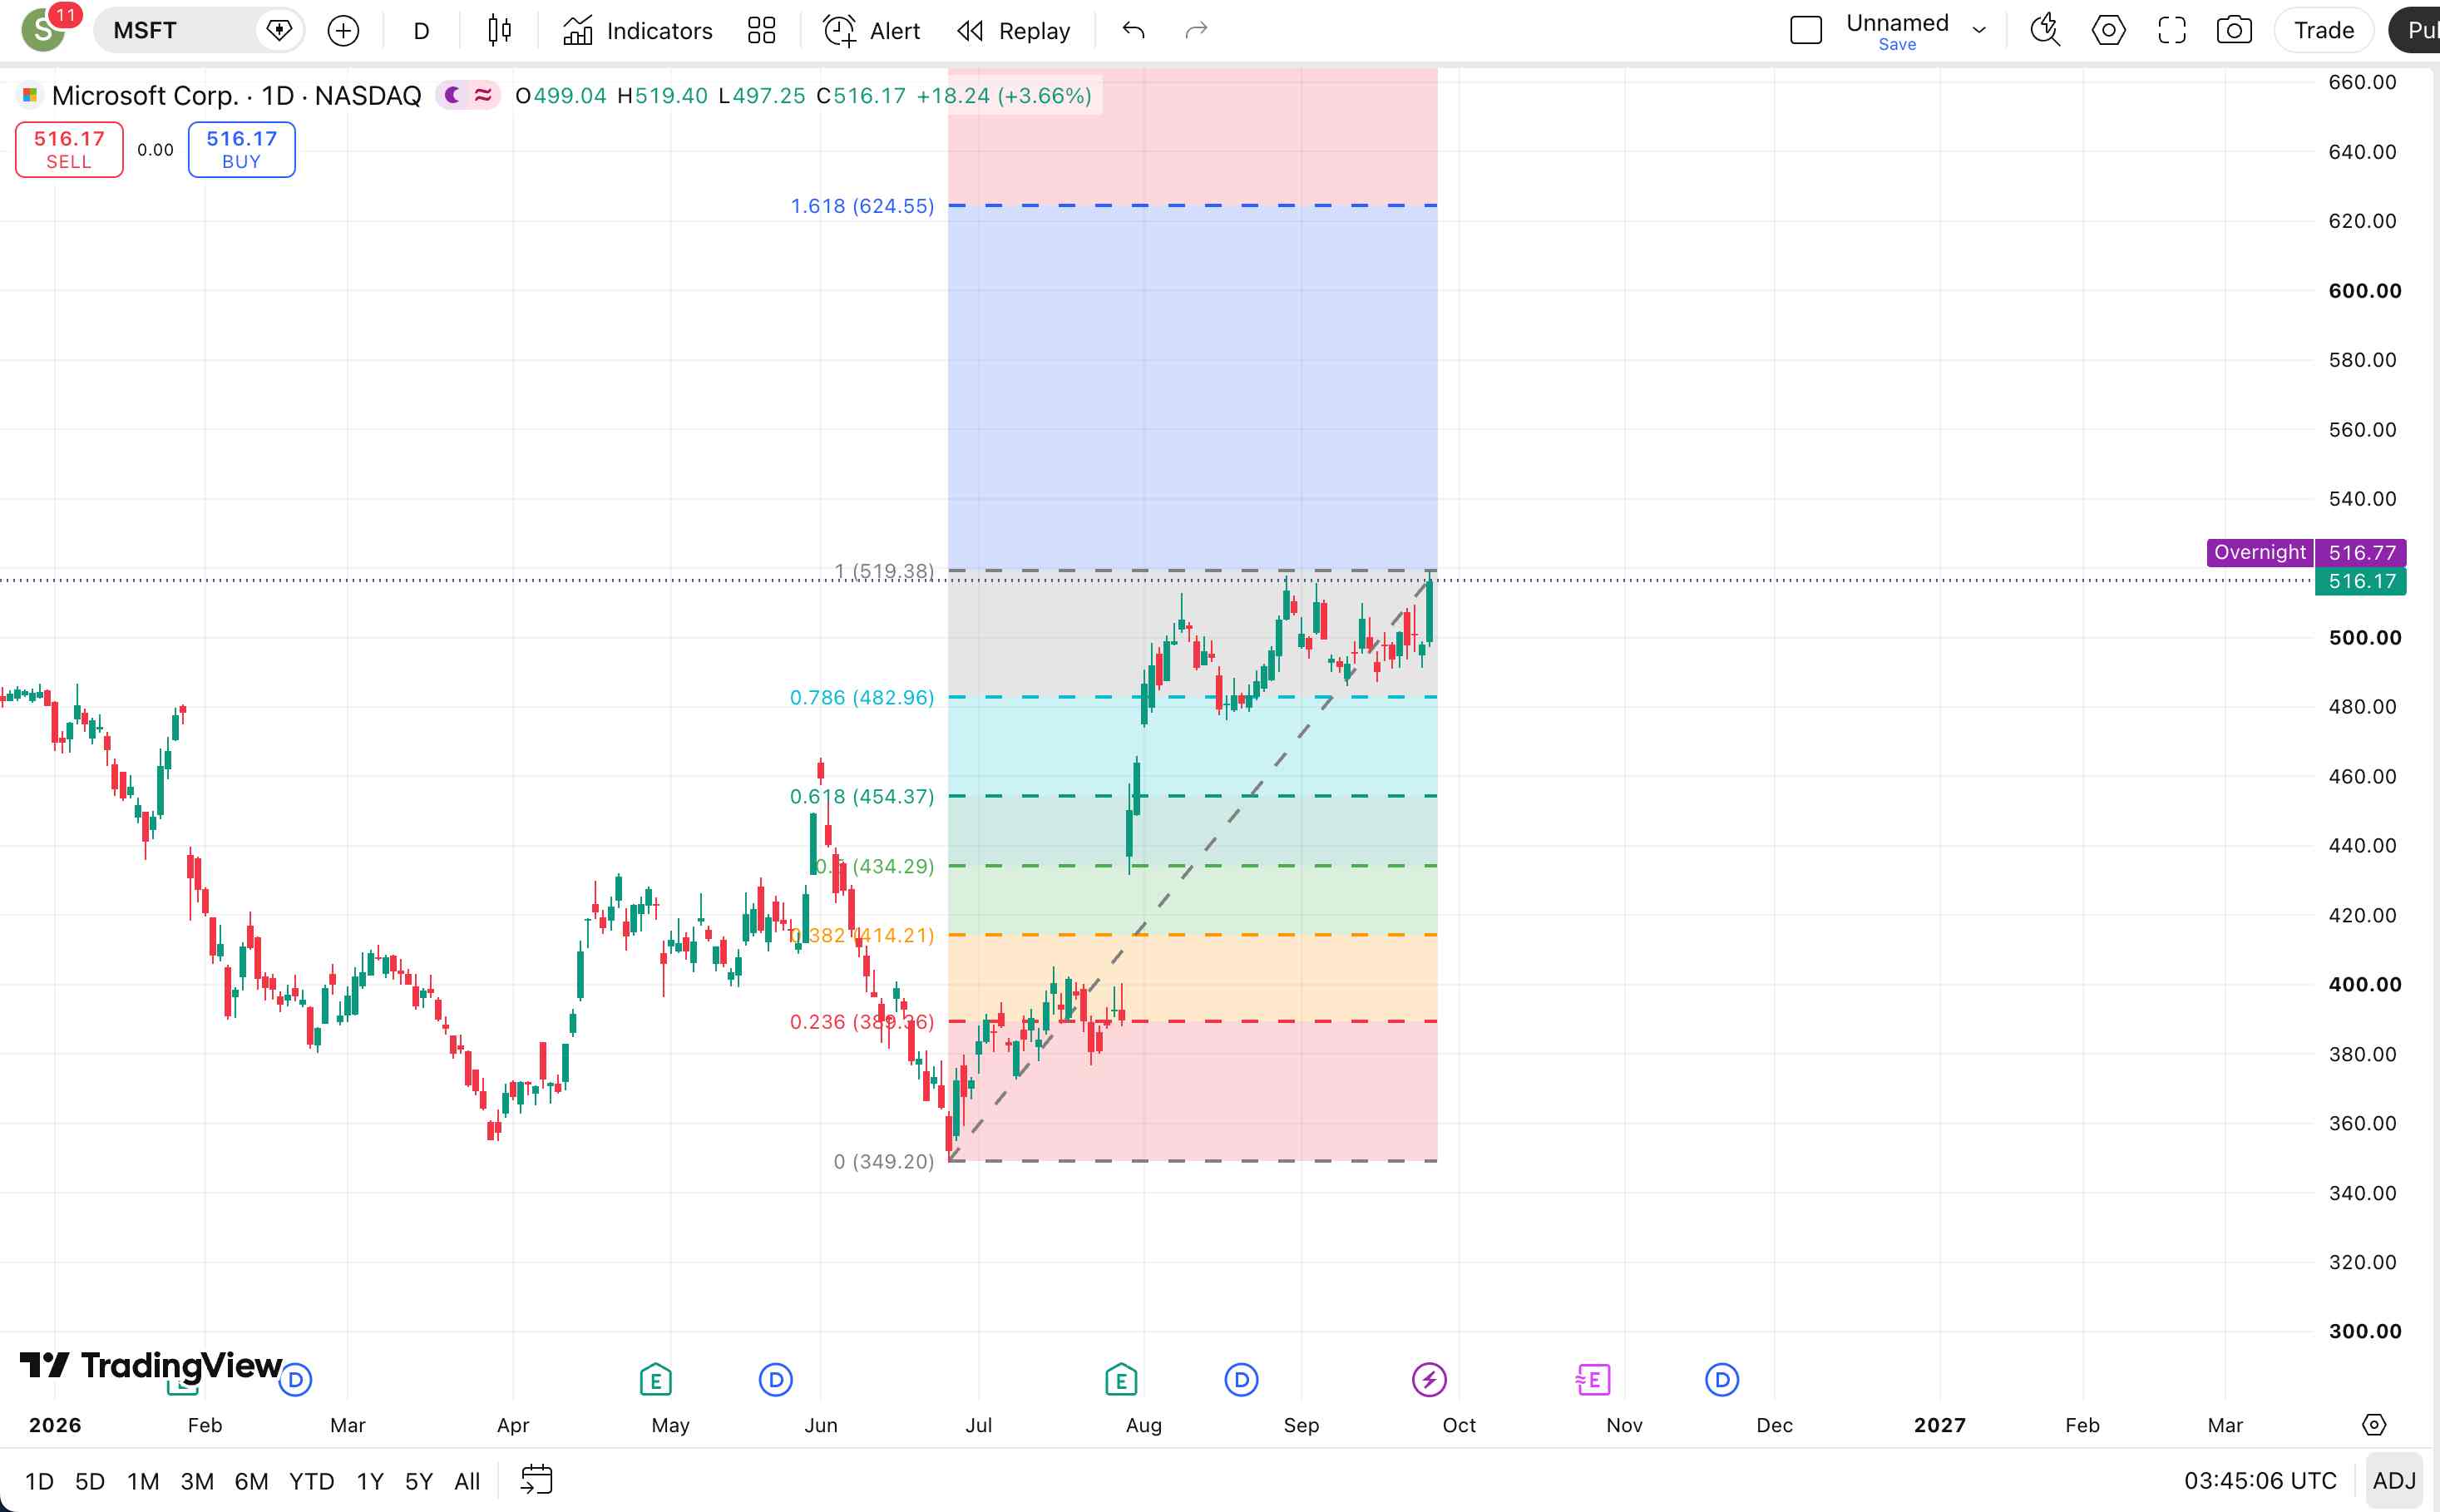
Taking the low of $349.20 on June 25, 2026 to the high of $519.38 on September 25 as the current rally wave, key Fibonacci levels are as follows:
Fibonacci Level | Price | Technical Significance |
Previous High | $519.38 | Current Breakout Level |
0.236 Retracement | $479.22 | Primary Retracement Support |
0.382 Retracement | $454.37 | Secondary Support |
0.500 Retracement | $434.29 | Medium-Term Bull-Bear Boundary |
0.618 Retracement | $414.21 | Key Support |
1.272 Extension | $565.67 | First Extension Target After Breakout |
1.618 Extension | $624.55 | Medium-Term Reference Level for Strong Trends |
From the daily chart structure, $519–$520 is currently Microsoft's most critical resistance zone. On September 25, the stock price touched a high of $519.38 and closed at $516.17, indicating that while it approached its previous high intraday, it has not yet confirmed a breakout on a closing basis.
On the upside, if MSFT breaks above $520 on heavy volume and consolidates, the stock price may first test the historical high zone of $535–$540; after a further breakout, the next target area to monitor would be $550–$566. Among these, $553.72 corresponds to the 52-week high, while $565.67 is the 1.272 Fibonacci extension level, together forming a medium-term resistance zone.
On the downside, the round number level of $500 acts as short-term support, but it is not a standard Fibonacci level for this complete wave. If the stock falls below $500, the next support zone is concentrated around $475–$480, where $479.22 corresponds to the 0.236 retracement level and $475.81 is near the 50-day moving average. If this level fails, the stock price may retest the $454–$460 area, with $454.37 being the 0.382 retracement level.
Overall, holding above $520 will sustain the upward structure, with subsequent focus sequentially on $535–$540 and $550–$566. If it falls below $479, the breakout momentum will weaken significantly, and the stock price may drop back further to around $454. The 1.618 Fibonacci extension level is approximately $624.55, but as it is far from current price levels, it is suitable only as a medium-term model observation level in a strong market scenario.
Find out more
Comments