TradingKey - Micron Technology (MU) will report its fourth-quarter fiscal 2026 results after the U.S. market close on September 30. The options market currently projects a stock price swing of up to 7.65% following the earnings release. Based on the current stock price of approximately $1,070, if results beat market expectations, the stock is expected to rise to $1,152, recovering all losses since July and returning above the key technical level of the 0.786 Fibonacci retracement ($1,144).
Meanwhile, memory industry fundamentals remain solid, with AI server demand continuing to expand. The latest research from TrendForce shows that HBM and traditional DRAM continue to compete for limited advanced node and wafer capacity. As yield improvements and capacity ramp-ups for next-generation products still take time, TrendForce expects memory supply to remain tight in 2027.
Against the backdrop of an ongoing upward trend in overall memory prices, suppliers have expressed a clearer stance regarding 2027 HBM price hikes. Considering sustained supply tightness, an increasing share of higher-priced HBM4, and the gradual volume ramp of HBM4e in the second half of 2027, TrendForce has raised its 2027 HBM price outlook, projecting that the blended ASP for HBM will achieve a year-over-year increase of 121%.
HBM Capacity Downgrade Doesn't Necessarily Mean Lower Unit Prices
TrendForce noted that several graphics processing unit (GPU) and application-specific integrated circuit (ASIC) vendors are currently discussing reducing the HBM capacity per chip. The reason is not weakening end-user computing demand, but rather persistent tightness in HBM supply, which has driven up overall system costs rapidly. As a result, vendors have begun seeking a balance between cost and supply through specification adjustments.
In the past, vendors mostly planned HBM using 12-layer stacks (12hi), but they are now beginning to evaluate 8-layer stacks (8hi). The 8-layer solution requires fewer memory dies, which lowers the bill of materials for each HBM and GPU; given the same HBM output, it can also support a higher volume of GPU shipments. Consequently, if supply tightness persists, the 8-layer option is expected to become a top priority for evaluation among multiple vendors in 2027, striking a balance among performance, supply volume, and cost.
However, a reduction in HBM capacity does not imply that the price per unit capacity will also drop. Every HBM requires a base die, and this cost component does not decline proportionally as the number of stacked layers decreases. Although 8hi offers lower capacity, it still absorbs a similar base die cost; on a per-Gb basis, the unit price may actually be higher. TrendForce estimates that in 2027, the price per Gb for 8hi could be about 10% to 20% higher than that for 12hi.
Overall, TrendForce believes that the HBM market will remain in short supply in 2027. Tight supply and rising costs may drive more GPU and ASIC vendors to adopt 8-layer solutions. However, because 8-layer products carry a higher cost per unit capacity, customers must still factor in this premium during specification and price negotiations as well as supply planning. Reducing HBM capacity can partially relieve cost pressures on GPUs, but it is unlikely to reverse the broader trend of sharp price increases for HBM.
Micron Technical Analysis: Two Scenarios May Emerge After Earnings
After rebounding from near its periodic low ($737.88), Micron Technology successively reclaimed the 0.382 Fibonacci retracement level ($935.35), the 0.5 Fibonacci retracement level ($996.35), and the 0.618 Fibonacci retracement level ($1,057.35). Recent prices pulled back after meeting resistance near $1,100, but the breakout structure has not been damaged.
Currently, Micron Technology's stock price is in a high-level consolidation phase after breaking above the 0.618 Fibonacci retracement level ($1,057.35), and has yet to form a new accelerated upward movement. Fourth-quarter earnings results will serve as a key catalyst determining the short-term direction.
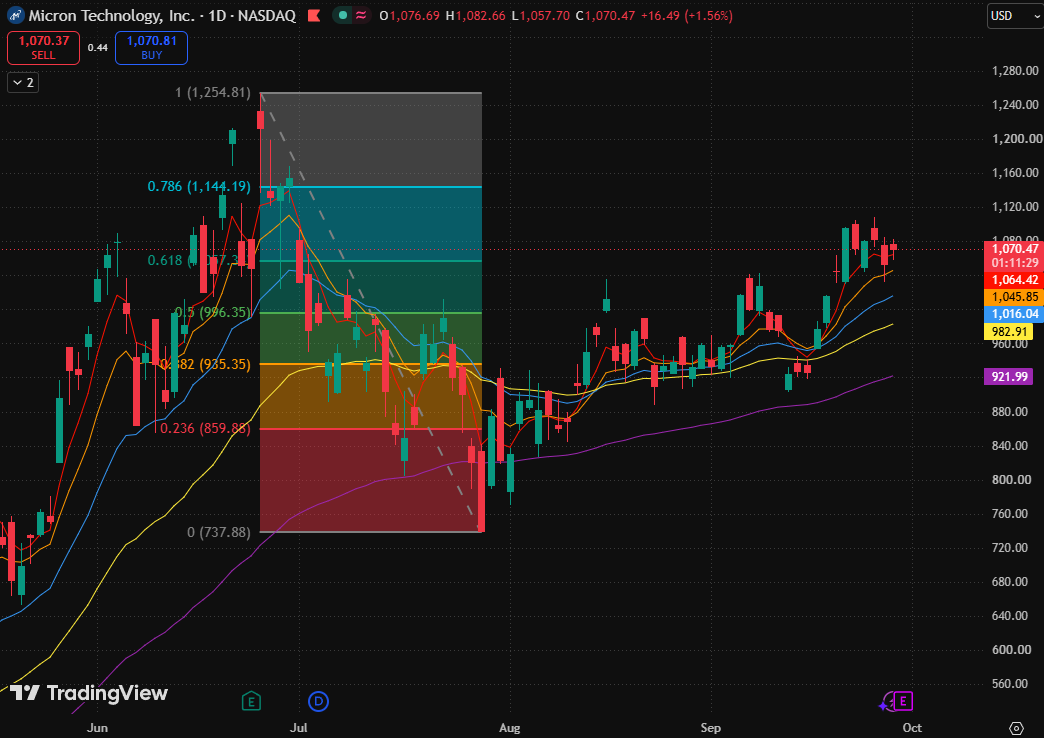
Micron Technology daily chart, Source: TradingView
Scenario 1: Rising to $1,152 post-earnings
If the stock price rises to $1,152 after earnings, it will cross the 0.786 Fibonacci retracement level ($1,144.19) while breaking through the recent high near $1,100. At that point, the trend is expected to shift from "high-level consolidation above 0.618" to "trend extension after breaking 0.786".
However, $1,152 is only $7.81 higher than $1,144.19, representing a breakout magnitude of about 0.68%, which leaves a slim margin of safety. Therefore, the initial gap price after earnings cannot serve as a standalone breakout confirmation; the key lies in whether the daily closing price can firmly stay above $1,144.19.
If the daily close holds firmly above $1,144.19, the breakout will be confirmed, with the next target looking toward the all-time high of $1,254.81. Along the way, the stock price may first digest gains in the round-number region between $1,180 and $1,200.
If the stock price surges to $1,152 and then falls back below $1,144.19, it may belong to a "sell-the-news" event or a false breakout, and could subsequently retest the area near $1,100.
Scenario 2: Falling to $993 post-earnings
If the stock price drops to $993 after earnings, it will break below the 0.618 Fibonacci retracement level ($1,057.35), while losing the 5-day moving average ($1,064.42), the 10-day moving average ($1,045.85), and the 20-day moving average ($1,016.04), falling slightly below the 0.5 Fibonacci retracement level ($996.35).
This means that the previous breakout structure above $1,057.35 would be damaged, and the market trajectory could shift from high-level consolidation to an earnings-driven deep pullback. However, $993 is only about 1% away from the 80-day moving average ($982.91) and remains within the key confluence support zone between $996.35 and $982.91; thus, it cannot yet be concluded that the medium-term trend has completely reversed.
If the stock price quickly reclaims $996.35 and moves back above $1,016.04, it would indicate that $993 might merely be a post-earnings panic low, after which the stock is expected to enter a gap-filling phase.
If the stock price consolidates weakly near $993 and its rebound is blocked at $1,016.04, it indicates that the original upward momentum has been disrupted, and short-term moving averages may shift from support to resistance.
If the daily chart breaks further below the 80-day moving average ($982.91), the correction will escalate further. The next key support level points to the 0.382 Fibonacci retracement level ($935.35), below which lies the 160-day moving average ($921.99).
Overall, tight HBM supply and rising prices support Micron Technology's medium-term fundamentals, but earnings on September 30 will determine the short-term direction of the stock price. On the upside, the key confirmation level is $1,144.19; on the downside, the support effectiveness at $1,016.04 and $982.91 will be crucial to observe.
Find out more
Comments