TradingKey - US September CPI Exceeds Expectations; Bitcoin Drops Below $83,000—Where Is the Next Defense Line?
On October 14, Eastern Time, the US September Consumer Price Index (CPI) came in higher than expected, once again triggering collective market concerns over sticky inflation and a slowing rate-cut path by the Federal Reserve, putting widespread downward pressure on cryptocurrencies. Among them, Bitcoin (BTC) fell below the key round-number defense level of $83,000, Ethereum (ETH) broke below the $2,500 mark, Ripple (XRP) dropped below $1.40, and Binance Coin (BNB) fell below $740.
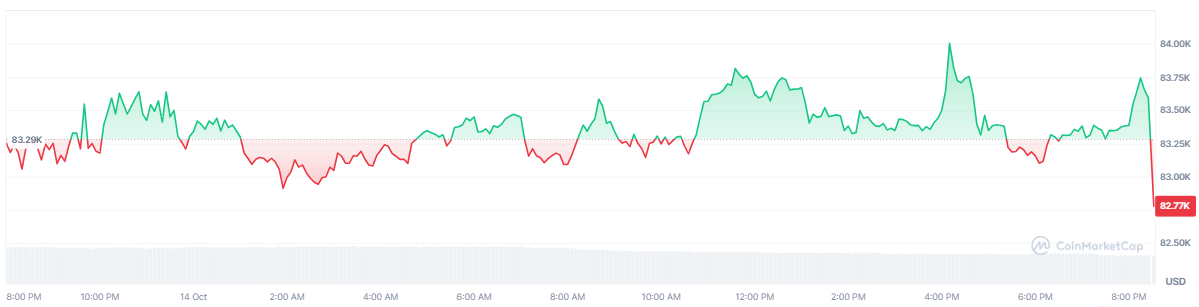 Bitcoin Price Chart, Source: CoinMarketCap
At 8:30 AM Eastern Time on October 14, the latest September CPI data released by the US Bureau of Labor Statistics was as follows:
Inflation Indicator (CPI) | Released Figure | Previous Value (Aug) | Market Forecast |
Headline CPI YoY | 3.6% – 3.7% | 3.4% | 3.6% |
Headline CPI MoM | +0.6% | +0.4% | +0.5% – +0.6% |
Core CPI YoY | 2.5% | 2.4% | 2.5% |
Core CPI MoM | +0.2% | +0.3% | +0.2% |
The hotter-than-expected CPI data not only dampened market expectations for rate cuts at upcoming FOMC meetings, but also strengthened the likelihood of an interest rate hike in October. According to CME FedWatch data, following the release of the CPI report, the probability of the Fed raising rates by 25 basis points in October surged from 21.6% to 32.7%, while the probability of keeping interest rates unchanged plummeted from 78.4% to 56.3%.
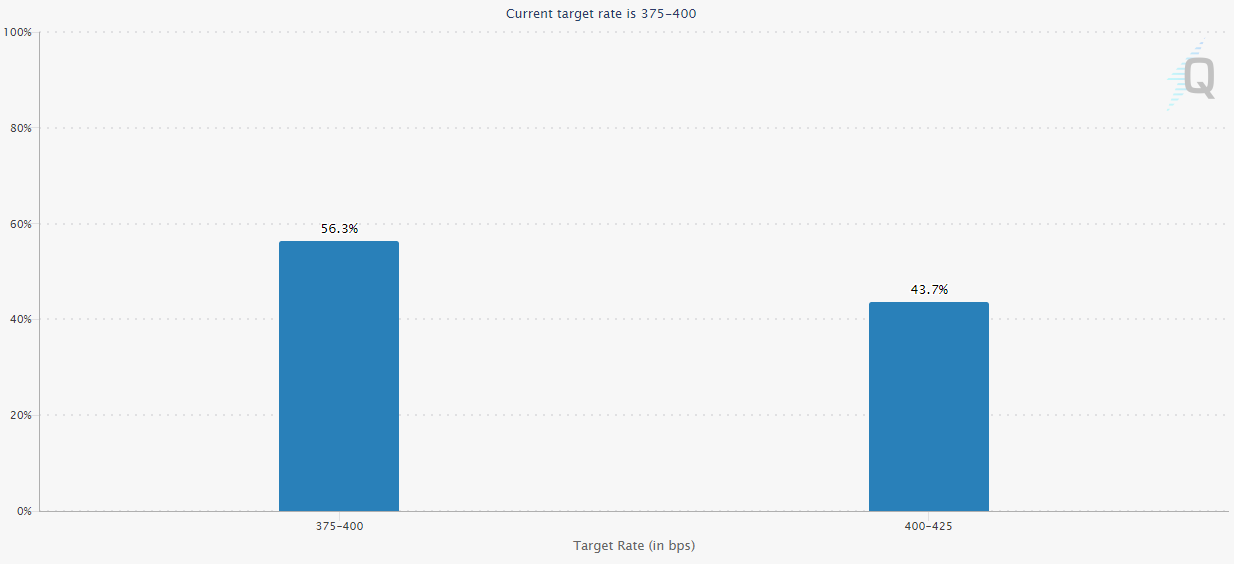 Market Expectations for the Fed's October Rate Decision, Source: CME
In the view of analyst Chris Anstey, the higher-than-expected core CPI also reinforces the possibility of further rate hikes by the Federal Reserve. He noted that today's stronger-than-expected core CPI increase will bolster expectations for further Fed policy tightening, making the September rate hike almost certainly not a one-off action.
For Bitcoin, $80,000 serves as a key defense line, representing the 50-day moving average and a high-volume consolidation zone from previous swing lows. As long as BTC can hold above this mark on reduced volume on the daily chart, its bullish structure remains intact.
Find out more
Comments