TradingKey - After market close on October 21, Meta (META) released its third-quarter earnings report, which showed revenue above expectations while its advertising business continued double-digit growth. However, after the report was released, its stock price plunged 6.98% on October 22. Why did the stock price fall despite revenue beating expectations?
Meta Q3 Earnings: Ad Revenue Keeps Growing, But Profit Declines as AI Capex Expands Further
Meta reported third-quarter revenue of $64.601 billion, up 26% year-over-year and exceeding prior market expectations of approximately $63.3 billion to $63.4 billion. Among this, advertising revenue reached $63.061 billion, an increase of about 26% year-over-year. Family of Apps ad impressions rose 10% year-over-year, with the average price per ad increasing by 14%; in September, Family Daily Active People reached 3.64 billion, up 3% year-over-year.
On the profit front, the company's third-quarter operating profit was $12.988 billion, down 37% year-over-year, with the operating margin falling from 40% in the prior-year period to 20%, and diluted EPS standing at $3.83. However, this quarter included approximately $9.89 billion in one-time legal settlement costs. Excluding this item, adjusted EPS was approximately $7.40; thus, the year-over-year decline in GAAP profit was significantly impacted by the one-time charges.
Notably, AI capital expenditures reflected in this earnings report continued to expand. Meta's third-quarter capital expenditures reached $34.91 billion, higher than $31.08 billion in the second quarter; operating cash flow was $32.79 billion, and free cash flow was negative $2.12 billion, compared with positive $10.63 billion in the same period last year. The company also narrowed its 2026 capital expenditure guidance to $135 billion–$145 billion.
In addition, Meta announced plans to establish new non-voting Class C common stock in 2027, which can be used for financing, employee compensation, and potential M&A. This arrangement expands the company's future fundraising toolkit, though the actual size and timing of issuance remain undetermined.
At the operational level, Meta stated that its personal AI assistant, Muse, surpassed 10 million users roughly six weeks after launching in the U.S. and Canada. The company expects fourth-quarter revenue of $73 billion–$76 billion, with a midpoint of $74.5 billion, above previous market expectations of about $73.7 billion. Going forward, it remains to be seen whether Muse and other AI products can deliver a clearer revenue contribution, and whether capital expenditure growth corresponds to sustained improvements in advertising, AI products, and cash flow.
Meta Stock Price Technical Analysis
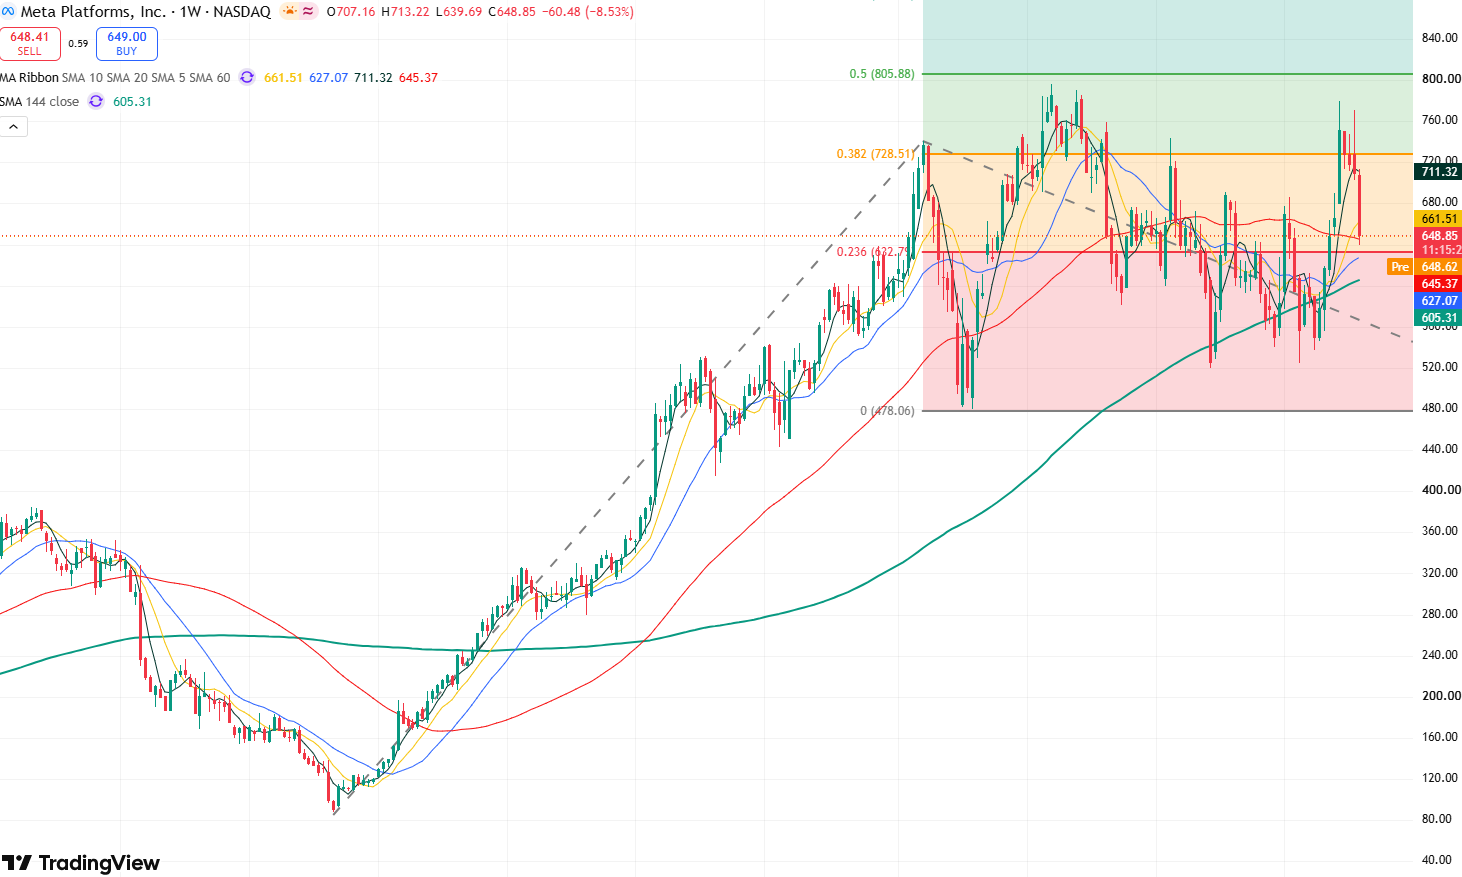
META weekly stock price chart, Source: TradingView
Looking at the weekly chart of META's stock price, the shares have rebounded continuously since late August, reaching a high of $779.82. However, they failed to break through the previous all-time high of $796.25 and subsequently began a continuous pullback. As of this week, the stock has recorded four consecutive weeks of declines, indicating that the recent market trend is leaning more toward the downside.
In terms of technical indicators, the Relative Strength Index (RSI) remains at 50.76, situated in neutral-to-bullish territory, indicating that overall market momentum remains tilted to the upside.
Currently, the stock price has been undergoing a continuous pullback recently, pulling back at one point to above the weekly 60-period moving average. If the stock price can hold firm above this moving average, market bulls will be strengthened, thereby supporting a price rebound. To the upside, the primary resistance level to watch is $690. If it breaks through this level, the stock price will test the key resistance level of $720. If the stock price can strongly break through and hold firm above this level, it is expected to challenge the resistance level near $790 once again.
On the downside, the primary support level to watch is the $640-$630 range. If the stock price falls below $630, it may test the $600 psychological level. If this level fails to hold, the stock price could fall further toward the support level near $520.
Find out more
Comments