TradingKey - As of the Asian session on Tuesday (November 10), Brent (UKOIL) crude extended Monday's weakness, falling about 0.55% intraday to a low of $91.47. Previously, Brent crude fell 5.91% on Monday to close at $92.19, touching an intraday low of $90.56, its lowest level since late August. Last week, Brent crude fell a cumulative 13.61%, marking its largest weekly decline since the early stages of the pandemic in 2020.
Trump Meets Qatari Prime Minister as US-Iran Talks Send Positive Signals
From a fundamental perspective, the primary driver behind Monday's sharp drop in oil prices was the anticipation of easing U.S.-Iran tensions.
On Monday, November 9, U.S. President Trump and Vice President Vance met separately with Qatari Prime Minister and Foreign Minister Mohammed to discuss matters related to resuming negotiations between the U.S. and Iran. Following the meetings, the Qatari Prime Minister stated that both sides held positive discussions on advancing U.S.-Iran talks and reaching an agreement.
Trump later stated that positive momentum has emerged toward a diplomatic resolution to the U.S.-Iran conflict and that there is currently no need to launch another large-scale military strike against Iran. However, he also emphasized that the U.S. still retains the capability to take military action if necessary and will continue to maintain its naval blockade of Iran.
The meetings signaled that the U.S. prefers prioritizing a diplomatic resolution to the conflict, lowering market expectations of a near-term military escalation. Previously, shipping disruptions in the Strait of Hormuz and attacks on Middle East energy facilities had continuously elevated the crude oil supply risk premium. As the likelihood of resumed U.S.-Iran negotiations grew, the market began reassessing the prospects for a recovery in Middle East crude exports, driving a sharp decline in international oil prices.
Brent Crude Oil Price Technical Analysis
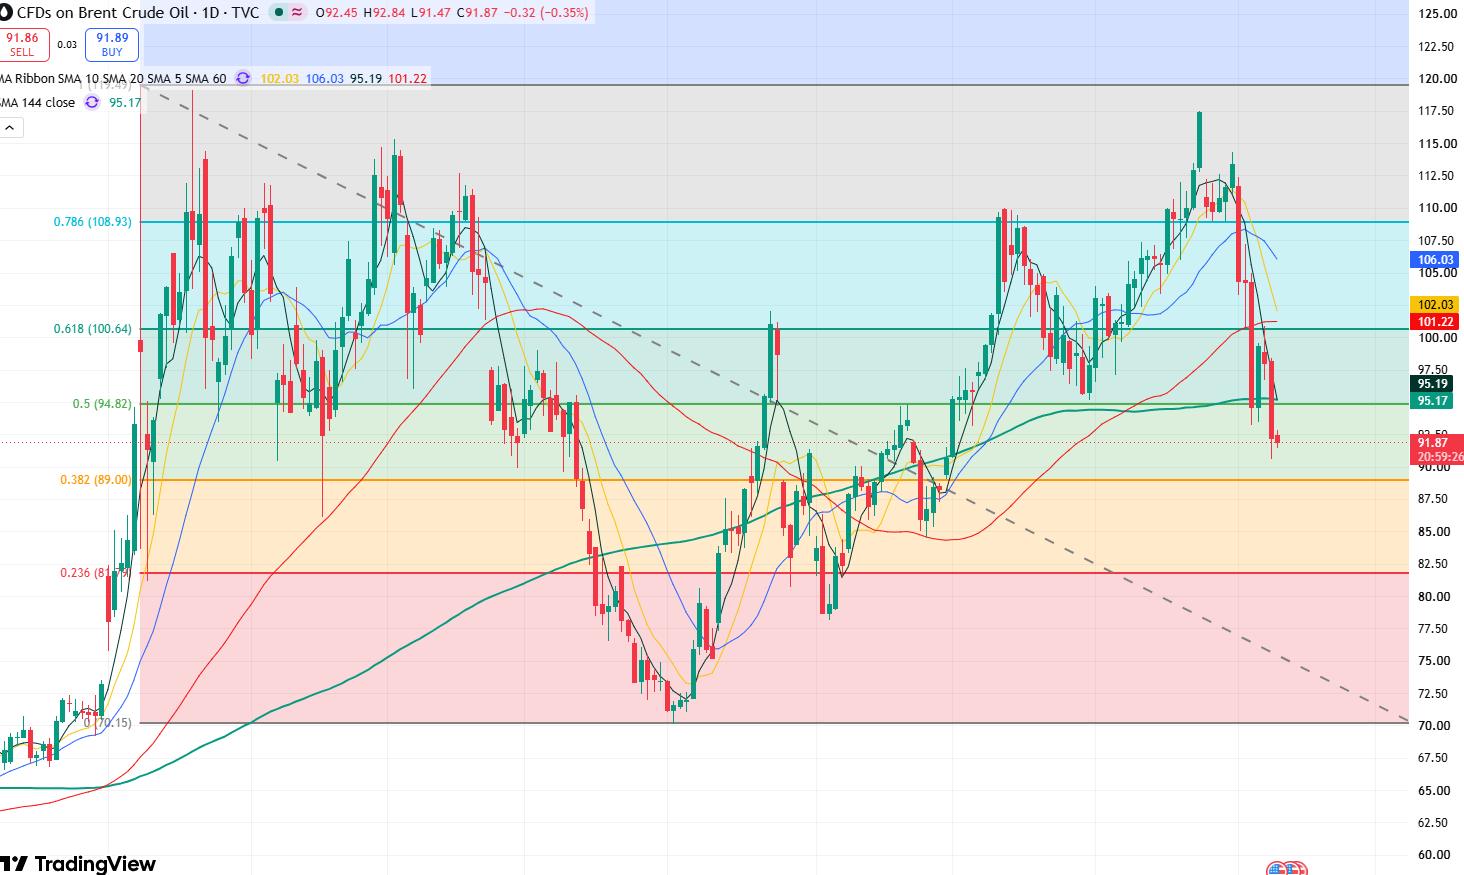
Brent crude oil price daily chart, Source: TradingView
From the daily chart of oil prices, prices have continued to decline since late October, consecutively breaking below the $100 mark and the key $95 support level. Meanwhile, oil prices have further fallen below the 144-day moving average, with the short-term candlestick pattern noticeably weakening, suggesting that oil prices may continue their downward trend in the short term.
In terms of technical indicators, the Relative Strength Index (RSI) is around 33.26, nearing oversold territory, indicating that further downside remains possible in the short term, though the potential for a technical rebound should also be noted; the MACD remains in bearish territory, showing that downward pressure has not yet dissipated.
On the downside, initial support for oil prices to watch is at $90–$89. If it breaks below $89, prices will further test the $85 support level; if this level is lost, oil prices will test the $80 mark.
On the upside, primary resistance for oil prices to watch is at $93–$95. If oil prices can break through and hold firmly above $95, it may open up room for a rebound toward the $100 mark; conversely, if oil prices remain under pressure below $95, the recent downward trend may continue.
Find out more
Comments