TradingKey - International gold prices extended their accelerating decline. On November 20, spot gold (XAUUSD) briefly dipped to around $3,514.6, having fallen for multiple consecutive trading days and successively breaching multiple key levels at $3,900, $3,800, $3,700, and $3,600 to reach its lowest level since September 2025.
Dollar and Real Rates Jointly Pressure Gold as Fed Rate Hike Expectations Heat Up
Higher-than-expected U.S. inflation data and a resilient labor market have prompted investors to reassess the Federal Reserve's policy path and bet on continued monetary tightening in December, becoming a major factor keeping gold prices under sustained pressure recently.
Federal funds futures data showed that as of November 20, the probability of the Fed raising interest rates by 25 basis points in December was approximately 96.5%, while the probability of a 50-basis-point hike was about 3.5%. Keeping rates unchanged has essentially been priced out by the market, and traders have also begun assessing the likelihood of consecutive rate hikes in 2027.
Chicago Fed President Austan Goolsbee stated that in an environment of stubbornly high inflation, all policy options must be considered. Philadelphia Fed President Anna Paulson also noted that persistently elevated inflation could force the Fed to raise interest rates further.
Against this backdrop, the U.S. Dollar Index rose about 0.5% this week, with the dollar hovering near a 19-month high. U.S. Treasury yields also remained elevated, with the 10-year yield climbing back above 5% and short-term interest rate expectations rising markedly as well.
Rising interest rates exert dual pressure on gold. Gold itself yields no interest, so when Treasury yields rise, the opportunity cost of holding gold increases, and some capital may rotate toward fixed-income assets. Meanwhile, a stronger dollar also raises the cost of purchasing gold for non-dollar investors, dampening international demand.
Beyond monetary policy factors, pullbacks in AI-related assets are also amplifying volatility in the gold market. Although Anthropic gained 17% on its debut, the move failed to reverse the broader weakness across U.S. tech stocks. On November 19, the three major U.S. stock indices all fell by more than 2%, as market concerns over AI returns on investment and financing models continued to mount.
International Monetary Fund (IMF) Managing Director Kristalina Georgieva recently warned that AI-related financial assets may still face further corrections. She pointed out that circular financing surrounding the AI industry has reached approximately $1 trillion, roughly two-thirds of which involves debt financing, and the pace of growth in this volume warrants attention.
When concentrated sell-offs hit tech stocks, investors not only trim high-risk assets, but may also sell liquid assets such as gold to cover losses in other portfolios or meet margin calls.
Kyle Rodda, senior financial market analyst at Capital, noted that a degree of forced liquidation is currently taking place in the market, with inflationary pressures, rate-hike expectations, and a stronger dollar jointly exerting downward pressure on gold.
Gold Price Technical Analysis: Focus on the $3,500 Level
Source: TradingKey
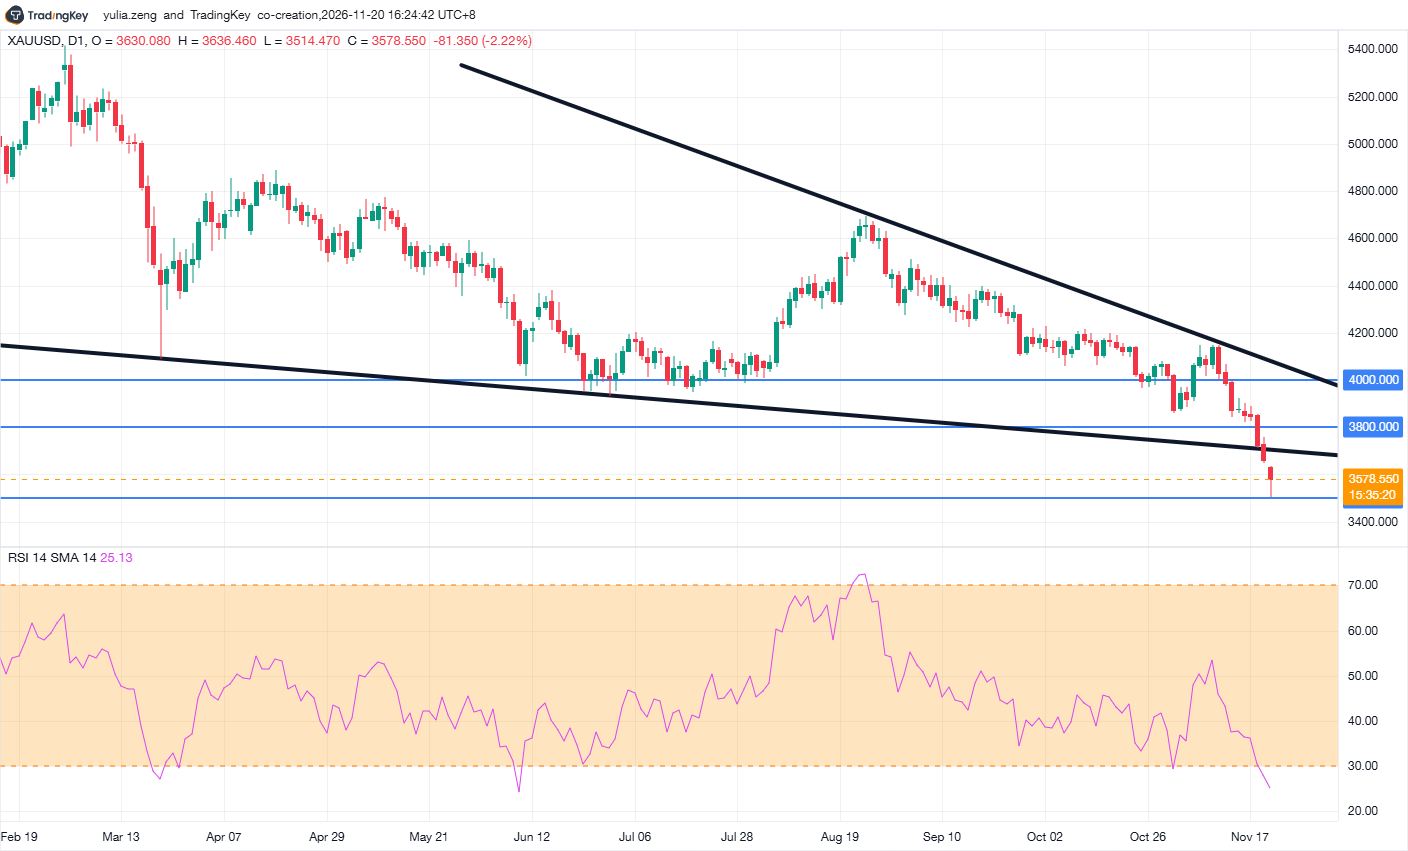
Looking at the daily chart, spot gold has been trading within a downward structure since pulling back from its year-to-date high, consistently posting lower highs and lower lows. A previously formed converging descending channel once provided support for gold prices, but prices have recently broken below $4,000 and $3,800 in succession, further piercing through the lower boundary of the channel. This indicates that the decline has shifted from an oscillating downtrend to an accelerated breakdown.
Gold is currently trading at around $3,578.55, after touching an intraday low of $3,514.6. The $3,500 level has become the most critical short-term support zone. If the price effectively breaks below $3,500 on a daily basis, the market may further test $3,400; if selling and forced liquidations continue to expand, the next notable medium-term support may lie near $3,300.
In terms of the Relative Strength Index, the 14-day RSI has dropped to 25.13, well below the oversold threshold of 30, indicating that short-term downward momentum is heavily concentrated. Once the RSI reaches this level, gold prices could see short covering or a technical rebound at any time, but oversold conditions do not equate to a bottom.
If $3,500 holds, gold will first need to reclaim $3,600 to ease short-term selling pressure. A further rebound would face dense resistance in the $3,700 to $3,800 zone, where $3,800 was not only previously significant horizontal support, but could also turn into resistance following the breakdown. Only a breakout back above $3,800 followed by stable trading would indicate that the decline is beginning to shift from a one-sided sell-off to base-building.
Find out more
Comments