Are You Ready For What’s Coming?
As we reach the end of the first half of this roller coaster year, and as the transmission of the monetary policy ensues, the macro picture across the world is now conveying clear signals about the future trajectory of growth and inflation.
Inflation, as expected, is finally behaving thanks to a confluence of factors, whereas growth is grinding to a halt as consumers run out of excess savings and the labor market loses steam, albeit slowly.
With this backdrop, today, we will dig deeper into the economic data of the past two weeks and look at where we stand today across the credit markets.
US Economic Data!
Last week we got the Fed’s most preferred inflation indicator: The Personal Consumption Expenditure (PCE).
As the CPI is marred with the lagged effects of the rent (the reason why JayPo loves the Core Services Ex-Housing), the Fed favours the PCE while chalking out the path of monetary policy.
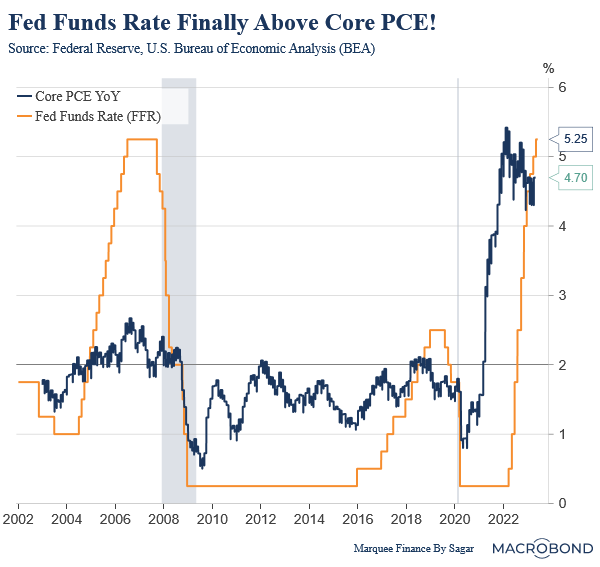
The Core PCE came in a bit hotter than expectations at 4.7% but is way past the Fed’s 2% benchmark.
Nevertheless, one can take solace in that the Fed Funds rate (FFR) is now comfortably above the Core PCE.
As we can see that in 2006, the rates remained higher for a considerable time (more than 18 months) before the subprime crisis and the housing collapse led to Fed aggressively cutting rates to nearly zero.
US Households (HHs) significantly deleveraged in the last decade, and most of the mortgages were refinanced at rock bottom interest rates post covid, thus insulating the households from the interest rate “shock”. Furthermore, core PCE is significantly higher than in 2007, which cements the case for “higher for longer” (which can be seen in markets pricing out rate cuts this year).
As a result, one can expect rates to remain higher for longer unless something breaks and the Fed is “forced” to cut (Note that elections next year are also a catalyst that one can’t miss).
While inflation (core PCE) will slowly claw back to the 3% mark by the end of the year, if there are no more shocks, the growth might slow down faster than anticipated.
In fact, there are early signs that growth has already been weakening. There was an unprecedented downward revision in the Personal Income data.
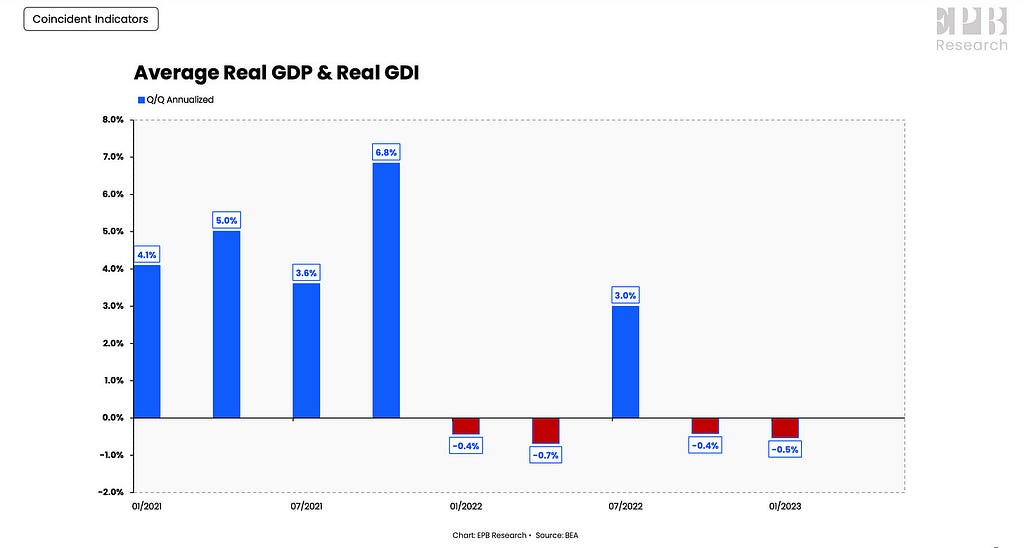
Furthermore, the street missed the most crucial GDP data, which the NBER closely tracks. The real GDI (Gross Domestic Income) shrunk by 2.3% in Q1 after a 3.3% Q4 contraction. The mind-boggling fact is that the average of Real GDP and Real GDI contracted for four of the past five quarters, thus strengthening the case for declaration of recession by NBER.
We are also very well aware that the real wages have been negative for many months now, eroding the purchasing power of consumers as seen in the retail sales data.
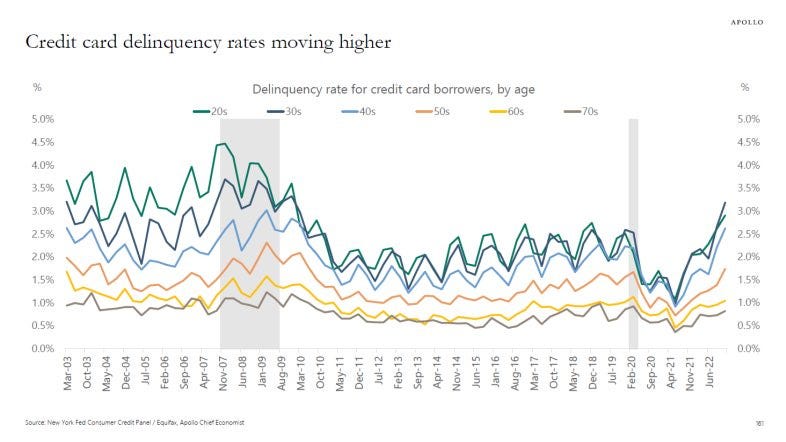
We need to appreciate that as student loan repayments start in Q3, consumption will undoubtedly slow further, and even delinquencies will rise. Already, 20%+ APR on Credit Cards is leading to an increase in delinquency rates, last seen in 2008.
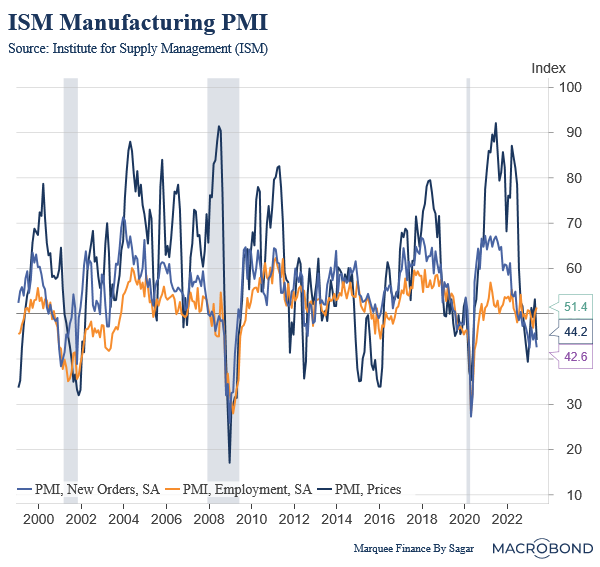
I have repeatedly reiterated that ISM remains the most significant measure to gauge cyclical activity.
The ISM data also confirms the enormous slowdown transpiring in the cyclical sectors of the economy. New Orders have entirely collapsed as the reading came in at a ghastly 42.6.
The two factors that are still keeping the ISM afloat above 45 are:
- First, the backlog of orders is still being cleared, thus helping the manufacturing sector.
- Second, employment is still holding above 50, thus helping the headline number.
Nevertheless, we will surely see cracks in the employment number as it contracts (and falls below 50) and production stalls as the backlog is cleared.
The current recession, as I discussed in detail, “ The Big Flip”, looks like it will be similar to a mild and short as in 2001 or the 70s. This looks apparent as the inherent strength of the labor market is stunning.
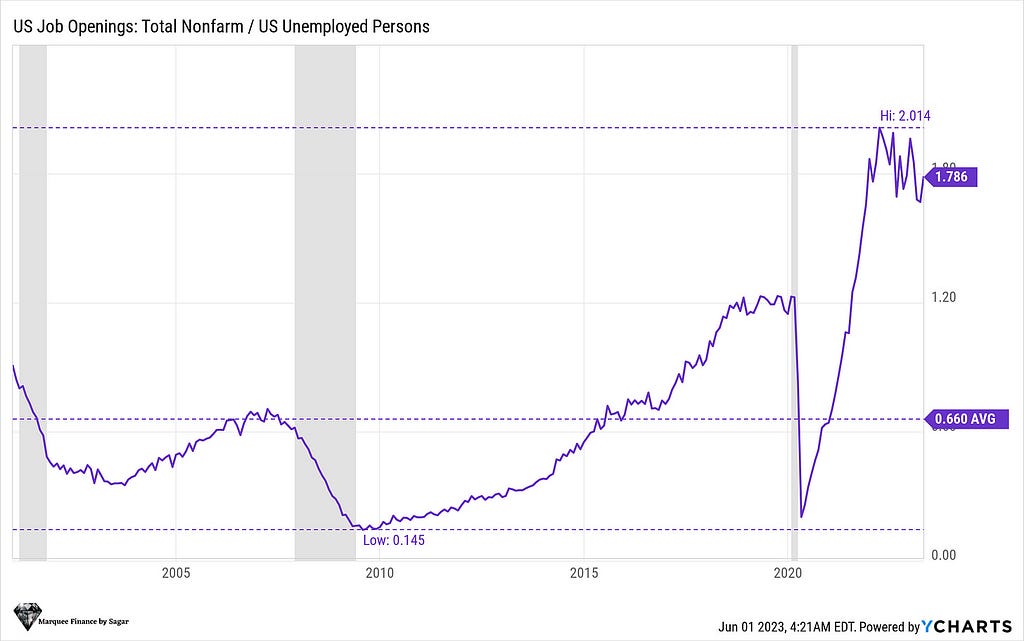
The Vacancies/Unemployed ratio remains elevated while the quit rates are slowly reverting to the mean. However, this week, the shocker was the rebound in the Job Openings (JOLTS) data and, thus, an increase in the Vacancies/Unemployed ratio.
Elections next year raises the probability of an event where heightened “weakness” in the labor markets will lead to the Fed prematurely cutting rates and buckling under political pressure.
US Credit Markets!
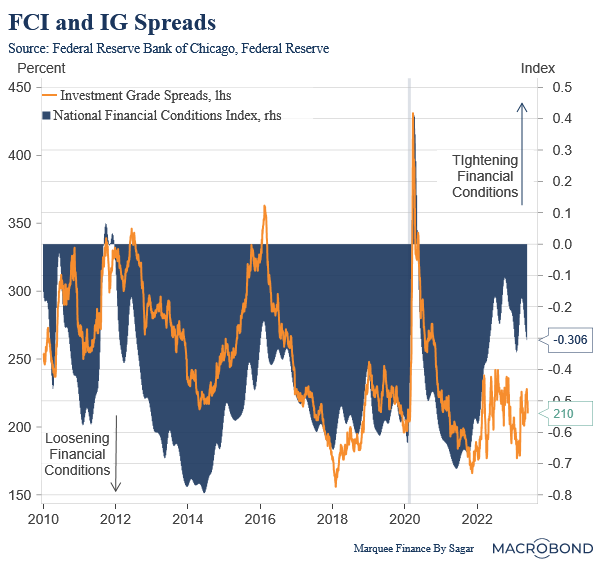
After SVB’s demise and the regional bank crisis, the Investment Grade spreads initially widened, and the financial conditions tightened; however, the spreads have tightened again, and the financial conditions are back to where they were when the Fed started raising rates.
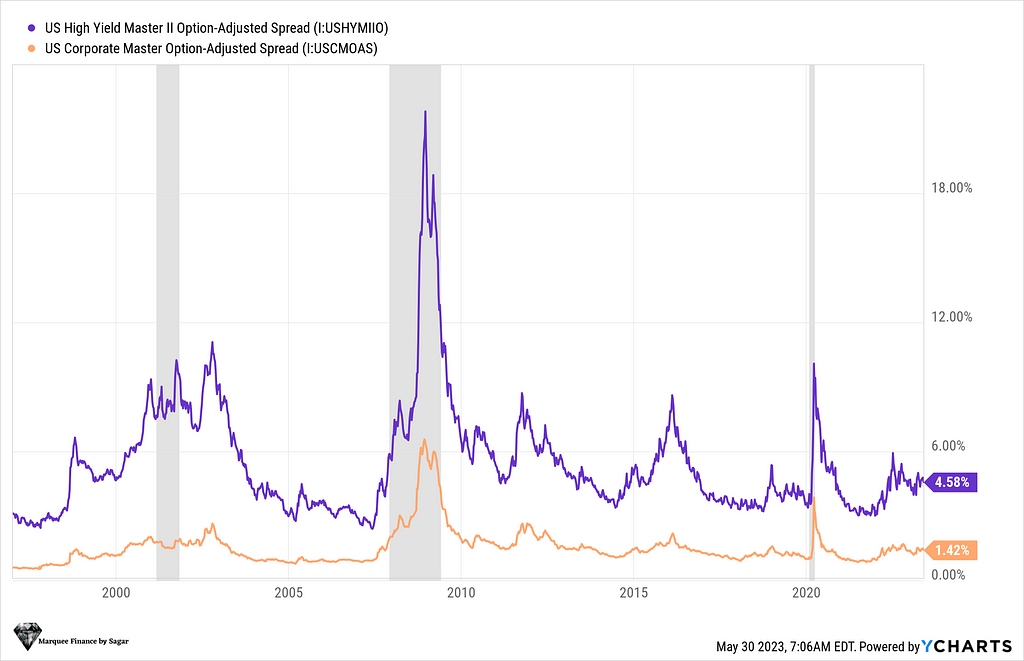
During the 2001 recession, the IG spreads remained extraordinarily tight all through the recession. Nevertheless, we must appreciate that the 2001 recession resulted from the shock arising from the negative wealth effect triggered by the dot-com bubble-led stock market crash.
While the IG spreads didn’t budge in 2001, the High Yield (HY) spreads did widen considerably before the recession started and even moved higher post the recession’s end.
The credit markets are positioned for a “soft landing” and aren’t factoring in rising defaults due to the lower profitability as the debt rollover takes place and companies face a double whammy of rising interest costs and slowing sales.
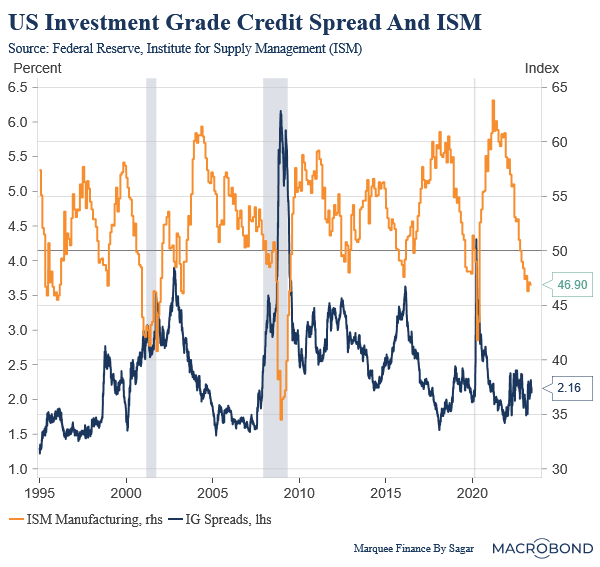
Maybe the markets are right, at least for the IG debt. 2001 was intriguing as the spreads rose after the recession ended, and the ISM moved back above 50.
One thing is for sure: with ISM at these levels, spreads can’t remain at these levels. Whether they rise with a lag or in the coming months as defaults pick up; is up to the markets to decide.
Nonetheless, as I am in the mild recession camp due to the exceptionally resilient labor market, the spreads might not widen considerably (way lower than what we witnessed in 2020 and 2008).
The yield curve is still inverted, but as the jobless claims rise consistently, we may see the steepening in the next 3–4 months.
Remember that the steepening yield curve is a bad omen for the equity markets.
European Data!
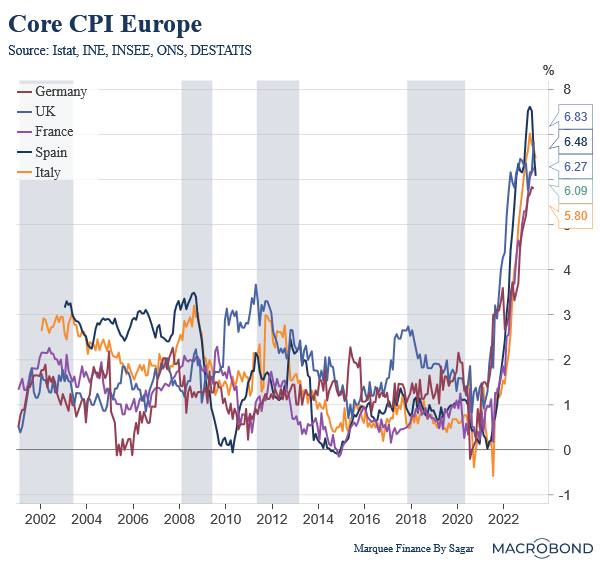
The high base effect in Europe is leading to a collapse in the headline CPI data, while the core inflation remains stubbornly high across Eurozone and the UK; in fact, some countries are witnessing an acceleration in the core inflation.
Nevertheless, a plunge in the headline number is a welcome relief for policymakers; however, it’s too early to declare victory as inflation can rebound swiftly due to exogenous factors. Furthermore, the labor market remains tight across Europe, and the nominal wage growth is higher due to unionization.
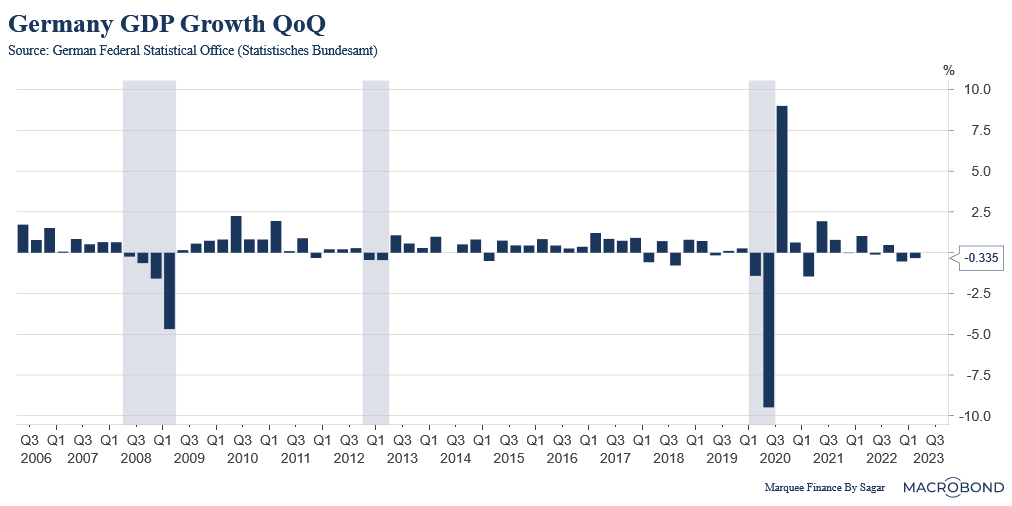
The growth across Euro Area is plummeting as the cyclical sectors of the economy take a toll due to rising rates. The manufacturing and housing activity has frozen (partly) thanks to the failed Chinese reopening. In fact, Germany is now in a “technical” recession as it has undergone two-quarters of negative growth.
As a result, Europe is more prone to the stagflationary scenario than the US. The thorn remains the “lagging” labor market which is holding pretty well as of now.
PS: The slide in growth will act as a tailwind for lower inflation. As a result, the headline number might surprise on the downside. Nonetheless, one needs to watch the core inflation closely.
Commodities!
As the Chinese reopening fizzles out, the commodities are taking it to the chin.
Long-time readers would remember that we exited the iron ore major Rio Tinto as the first signs emerged about the weakening Chinese data. The horrific scenes of commodities getting battered are now all over, especially for those linked to the construction and manufacturing sectors.
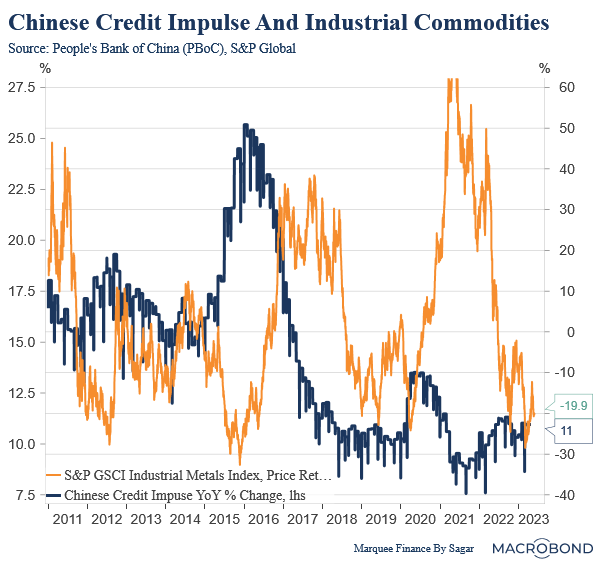
Furthermore, the credit impulse is fading and has likely peaked in the short term in China. This will be a significant headwind for industrial commodities as the Chinese credit impulse leads the price action in Industrial Commodities.
However, China’s struggle also means more stimulus is back on the table, and PBoC might continue to ease. One can also expect significant fiscal measures by the Chinese Government if the growth and the property sector fail to revive.
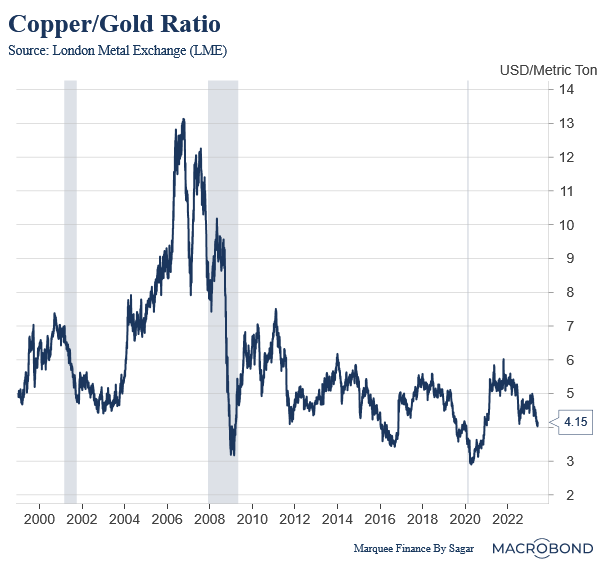
My favourite indicator for a global recession and proxy for global growth is flashing red and continuing the downward descend.
Conclusion!
In the US:
- A recession with the lowest employment rate will be declared by NBER later this year.
- Core PCE remains elevated and is expected to slowly claw back to 3% by the end of the year.
- As excess savings dry up, policy transmission occurs, wage rise halts and student loan moratorium ends, consumption will take a significant hit in H2.
- ISM numbers point out a further contraction in cyclical activity. This will act as a tailwind for lower inflation.
- Election year makes the task challenging for the Fed as UR rises in the next few months.
In Europe:
- Headline number (inflation) is witnessing a steep fall across EA while the UK grapples with sticky inflation.
- The core number remains elevated; however, a collapse in the cyclical economy and, thus fall in growth might lead to downward pressures on inflation.
- There is a high probability of stagflation in Europe.
Commodities:
- The copper/Gold ratio is taking a deep dive, indicating a slowdown in global growth.
- The outlook is turning bearish for industrial commodities. Nevertheless, the Chinese stimulus remains a silver lining.
- Follow me on Medium❤
- Follow me on Linkedin❤
- Follow me on Twitter❤
Back To Basics! was originally published in DataDrivenInvestor on Medium, where people are continuing the conversation by highlighting and responding to this story.

Comments