
1. Key Information
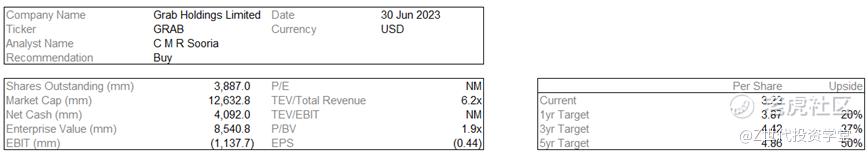
2. Executive Summary
Grab Holdings (NASDAQ:GRAB) is a leading superapp in Southeast Asia, providing everyday services to millions of Southeast Asians. The business is split into 4 main segments: Deliveries, Mobility, Financial Services and Enterprise and New Initiatives. Revenue from Deliveries and Mobility contribute to over 90% of the total revenue while Singapore and Malaysia remain the largest markets for the company accounting for over 50% of the total revenue. With a strong opportunity to capture a greater market share by riding the digital wave in SEA, a well-formulated hyperlocal strategy and continued investments in technology and infrastructure, I initiate a buy recommendation for Grab.
3. Company Overview
Grab is one of Southeast Asia’s leading superapps, operating primarily across the deliveries, mobility and digital financial services sectors. It enables users to access drivers and merchant partners to order food or groceries, send packages, hail a ride or taxi, pay for online purchases or access services such as lending, insurance and wealth management. Based on a research done by Euromonitor in Southeast Asia in 2022, Grab remains the category leader in Southeast Asia by Gross Merchandise Value (GMV) in online food delivery and ride-hailing.
a. Company History
In 2012, Grab first started off as the “My Teksi” app in Malaysia and was the brainchild of Mr Anthony Tan, founder and current CEO of Grab and Miss Tan Hooi Ling, co-founder and ex COO of Grab. Following its success and growth, it relocated its headquarters to Singapore in 2014 and expanded rapidly to other Southeast Asian countries such as the Philippines, Thailand, Indonesia, Vietnam, Cambodia and Myanmar. In 2016, My Teksi was rebranded as Grab. Between 2015-2018, Grab launched ventured to several new business streams such as delivery, financial and advertising services while improving its mobility division through new additions such as GrabHitch and GrabShare.
In 2018, Grab completed the acquisition of Uber’s business in Southeast Asia through an all-share deal and listed on the NASDAQ in 2021.
b. Business Segments
The business is split into 4 main segments:
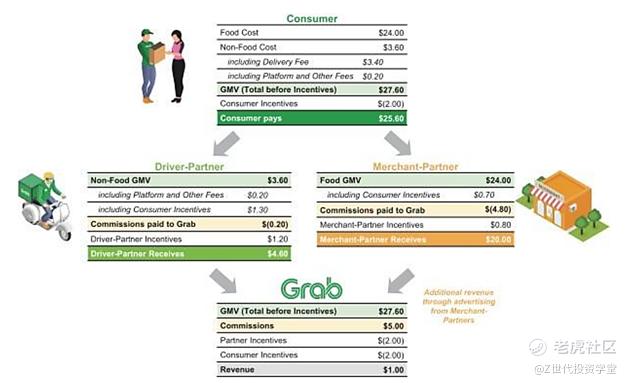
(i) Deliveries – The offerings within this segment include GrabFood, GrabKitchen, GrabMart, GrabExpress, and GrabKios. Revenue is generated from commissions and other fees from driver and merchant partners and consumers for connecting driver and merchant partners with consumers to facilitate delivery of a variety of daily necessities, including ready-to-eat meals and groceries, as well as point-to-point parcel delivery. Revenue from the deliveries segment is recognized on the completion of a successful transportation or delivery service by driver and merchant partners. The diagram below illustrates the economics of a typical deliveries order:
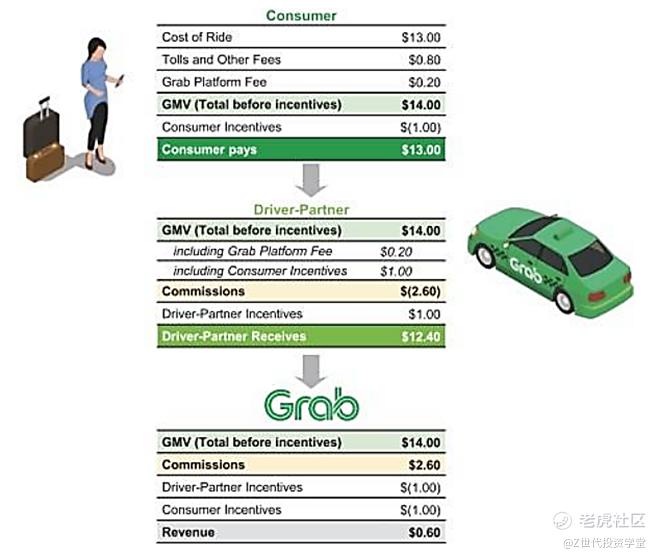
(ii) Mobility – The offerings within this segment include GrabCar, GrabTaxi, JustGrab, GrabBike, three-wheel vehicles, GrabShare, and GrabRentals. Through GrabRentals, the company utilizes Grab’s fleet of cars to provide one-stop car rental to driver-partners.
Revenue is generated from commissions paid by driver partners and platform fees from consumers for the use of the platform. Revenue from the mobility segment is recognized net of driver partner and consumer incentives and upon the completion of each ride. Within the segment, revenue is also generated through rental fees from GrabRentals offering. The diagram below illustrates the economics of a typical ride:
(iii) Financial Services – Within this segment, offerings include digital solutions to address the financial needs of our driver and merchant partners and consumers, including digital payments, lending, receivables factoring, insurance and wealth management. Revenue for this segment is primarily generated from transaction and commission fees. For payment services, revenue is driven by transaction fees from merchant partners and transaction platforms based on a percentage of transaction volumes. As for lending and receivables factoring, revenue is generated based on the interest income received from loans extended and from the factoring fee or discount when Grab purchases the receivables.
(iv) Enterprise and New Initiatives – The key offerings within this segment are GrabAds, GrabMaps and other lifestyle offerings. GrabAds provides online and offline advertising solutions for brands across three categories: 1) mobile billboards, which turns the company’s fleet of vehicles into roving billboards to generate offline awareness, 2) in-car engagement and 3) in-app engagement, which includes merchants-featured advertising and other digital content through the app.
GrabMaps is a B2B offering providing base map data and map-making tools and software-as-a-service. Application Programming Interface (APIs), launched in January 2023, and Mobile Software Development Kits (SDKs) that remains in the testing phase, will allow developers and teams to enhance or build their own applications and geolocation capabilities leveraging GrabMaps technology, such as routing, search, traffic and navigation features.
Revenue from this segment primarily consists of advertising revenue earned from the GrabAds offering. Other revenue is generated from lifestyle and other offerings through the commissions that Grab receives when such services are sold through the platform.
4. Revenue Breakdown and Performance

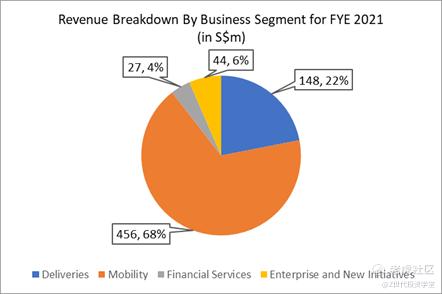
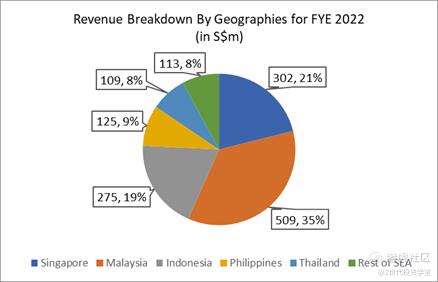
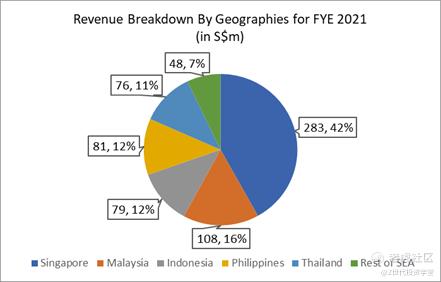
Overall revenue for 2022 stood at S$1,433 million, increasing by S$758 million from S$675 million in 2021. Singapore and Malaysia remain the largest markets for the company accounting for over 50% of the total revenue in both 2021 and 2022.
Deliveries revenue was S$663 million in 2022 compared to a revenue of S$148 million in 2021. The increase was driven by an increase in deliveries GMV of 15%, to S$9.8 billion in 2022 compared to S$8.5 billion in 2021, driven primarily by increasing consumer demand and number of merchant-partners using the platform.
The increase in revenue for deliveries was primarily driven by contributions of S$334 million from Jaya Grocer[1], an increased Q4 performance and a disciplined approach to reducing incentives as a percentage of GMV as the company focuses on driving higher quality GMV transactions. Deliveries revenue as a percentage of deliveries GMV improved from 2% in 2021 to 7% in 2022 as the business gained network efficiency in its driver-partner base and was able to improve overall value proposition in terms of merchant selection, delivery performance and application experience on its platform.
Mobility revenue was S$639 million in 2022 compared to S$456 million in 2021, which was primarily due to ride hailing revenue increasing by S$154 million and rental income from motor vehicles increasing by S$28 million. The increase in revenue was primarily driven by the strong demand recovery following the easing of COVID-19 restrictions in 2022 as Southeast Asia opened up and lifted most travel and movement restrictions. GMV for mobility increased to S$4.1 billion in 2022 compared to S$2.8 billion in 2021, while mobility revenue as a percentage of mobility GMV remained consistent at 16% in 2022 and 2021.
Financial services contributed S$71 million to the revenue in 2022, increasing from the S$27 million in 2021. The increase was primarily due to a S$41 million growth in its lending business as loans disbursed grew 122% from 2021 to 2022.
Enterprise and new initiatives revenue was at S$60 million in 2022, increasing by S$16 million compared to S$44 million in 2021. The increase was primarily due to growth of GrabAds revenue by S$11 million with the expansion of product offerings.
5. Cost Breakdown
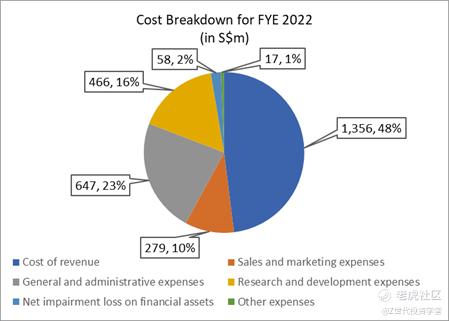
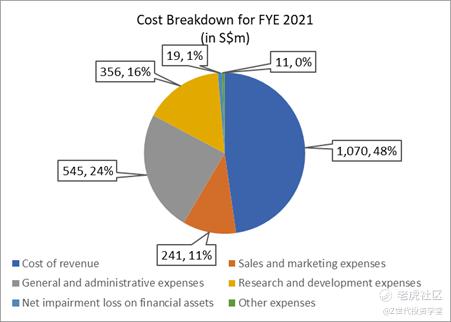
Total operating expenses stood at S$2,823 million for 2022, S$581 million higher than 2021’s S$2,242 million.
Cost of revenue, which accounts for 48% of the operating expenses, mainly comprises expenses attributable to the 4 revenue generating segments, primarily data management and platform related technology costs including amortization of technology and market activity related intangible assets, compensation costs (including share-based compensation) for operations and support personnel, payment processing fees, costs incurred in relation to its motor vehicle fleet used for rental services (including depreciation and impairment) and an allocation of associated corporate costs such as depreciation of right-of-use assets.
General and administrative expenses, which accounts for 23% of the operating expenses, primarily consist of compensation costs (including share-based compensation) for executive management and administrative personnel (including finance and accounting, human resources, policy and communications, legal, facility and general administration employees),
occupancy and facility costs, administrative fees, professional service fees, depreciation on certain administration assets, legal costs and allocation of associated corporate costs.
Sales and marketing expense, which accounts for 10% of the operating expenses, primarily consists of advertising costs and compensation costs (including share-based compensation) to sales and marketing employees. The company is expected to continue to invest in sales and marketing expenses to attract and retain platform users and increase its brand awareness.
With the Company’s recent cost cutting measures including laying off 11% (1000 employees) of its total workforce, the operating expenses for 2023 is expected to reduce significantly.
Comments