Hello fellow traders. In this technical article we’re going to take a quick look at the Elliott Wave charts of SPX published in membership area of the website. As our members know, S&P500 is trading within the cycle from the October’s 3492.7 low, which is unfolding as 5 waves structure. Recently we got 3 waves pull back which found buyers right at equal legs area as we expected. In the further text we are going to explain the Elliott Wave Forecast
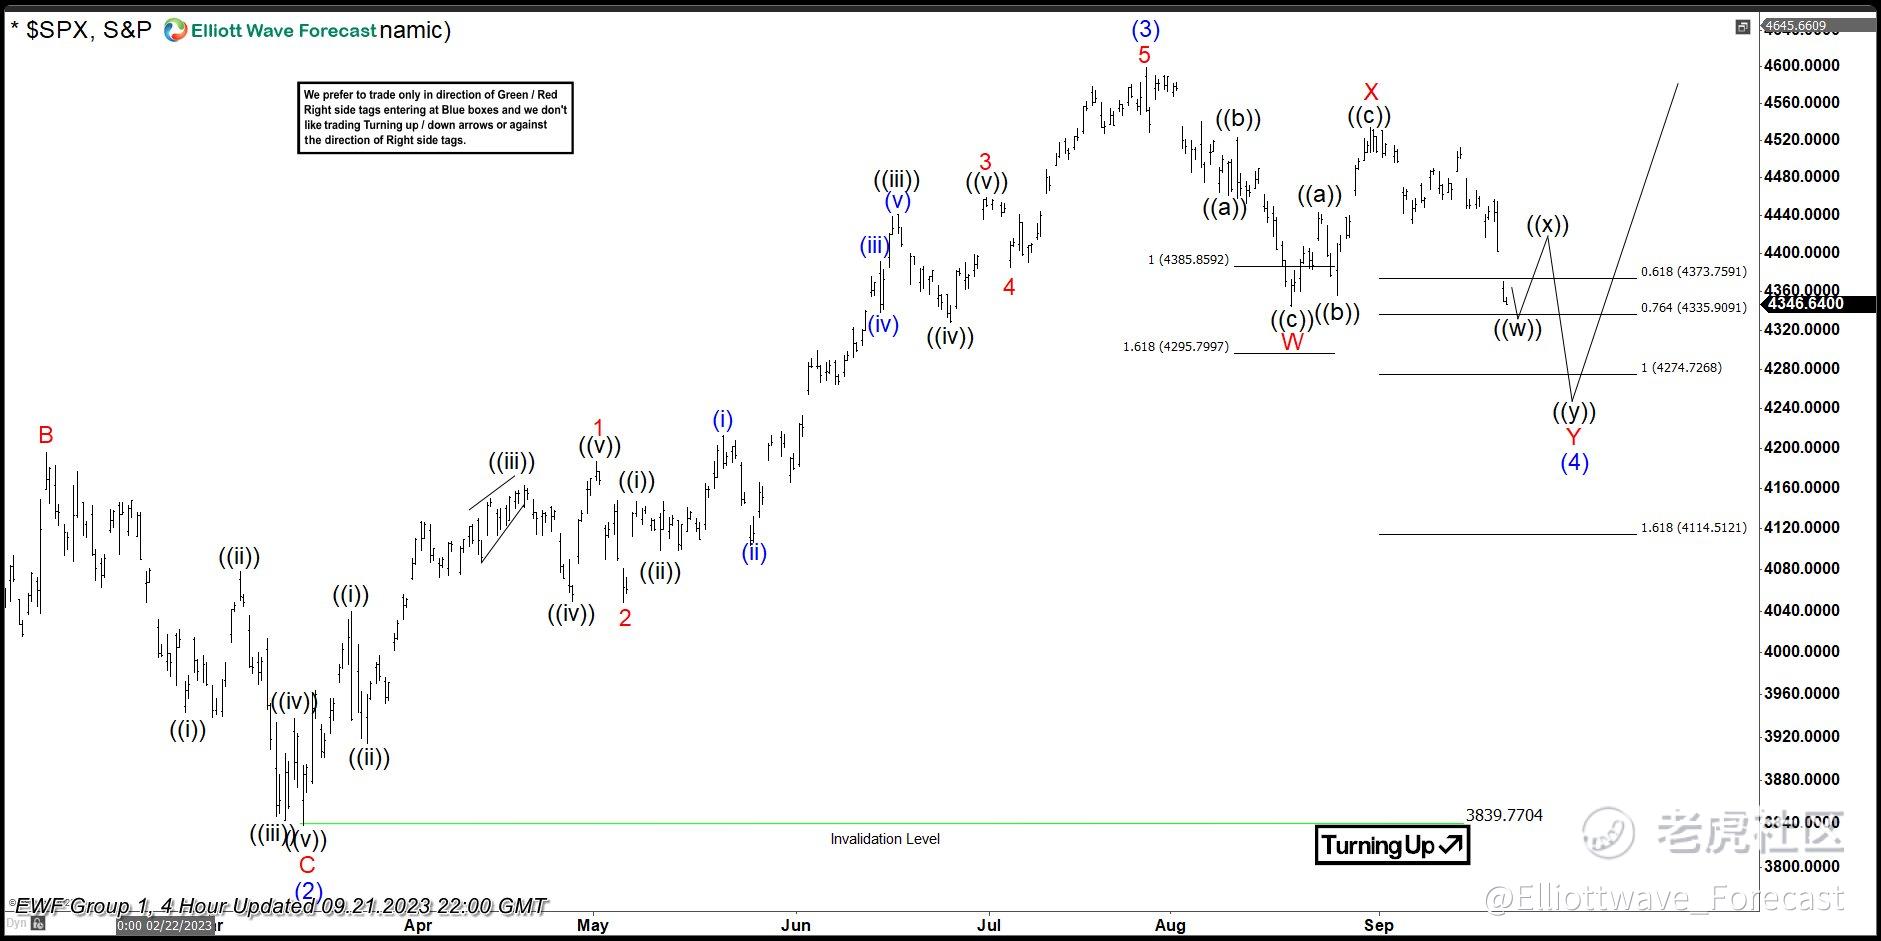
SPX 4h Elliott Wave Analysis 09.21.2023
SPX is doing wave (4) blue pull back. The index is correcting the cycle from the 3839.7 low. Pull back looks incomplete at the moment. We expect another leg down toward 4274.7-4114.5 area to complete the correction.
Reminder: You can learn about Elliott Wave Rules and Patterns at our Free Elliott Wave Educational Web Page.
https://elliottwave-forecast.com/stock-market/sp500-spx-found-buyers-equal-legs/
Comments