Summary
- Market correction offers an opportunity for potential upside.
- Fed's interest rate policy strategy and economic data indicate a strong US economy.
- Technical indicators and market breadth suggest a potential market bottom and upward trend.

RapidEye/iStock via Getty Images
Introduction
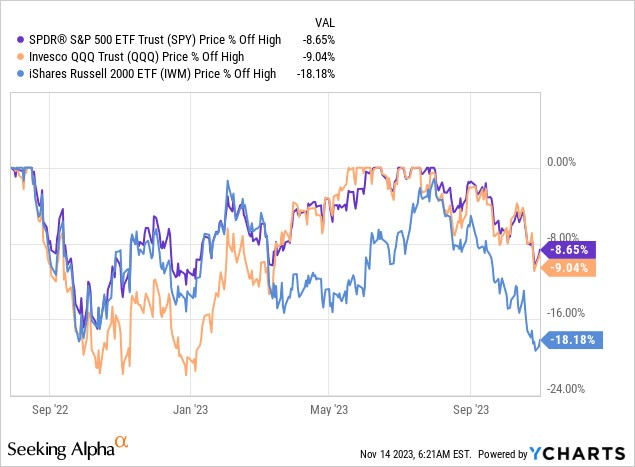
Today, we want to take a step back and look at the overall market conditions, especially after the somewhat volatile few months we have had on the market since the end of July. The market found a local top in late July, dropping approximately 10% and entering correction territory. Both the S&P500 (SPY), Nasdaq (QQQ), and especially the Russell 2000 (IWM) suffered through this two-month-long correction period.
Ycharts
We believe this correction offers an incredible opportunity to position yourself for a potential run to the upside. Many technical indicators for market breadth suggest that the market is severely stretched to the downside, and the indices may be carried primarily by the biggest companies in them.
We will be focusing primarily on various technical indicators that, in the past, have proven to help determine times when the market has bottomed. These indicators will primarily give an overlook of market breadth in the Nasdaq.
However, much of the findings can be applied to the S&P500. The number of charts will be extensive but not exhaustive. In addition, we will discuss some of the fundamental economic indicators that the FED highlighted over the last year.
We hope that throughout this article, you will gain some insight into what we see in the market and the similarities between now and the rallies from October 2022 and March of this year. We will appear overall bullish throughout this piece because we believe there is enough evidence to justify a bullish sentiment in the coming months. With that being said, it is likely that the market will see a slight downturn or consolidation period. This is because the market is overall a bit stretched after the aggressive run in the past two weeks.
Jerome Powell and the Fed
For those keeping an eye on economic news, a curious trend has emerged lately: the " good news is bad news" scenario. It might initially seem strange – why would robust economic data be seen as bad for the stock market? The key lies in the close watch by major market players on the Federal Reserve's interest rate policy strategy. Since the great financial crisis, the FED has pushed interest rates to their highest levels, currently at 525 – 550 basis points.
Now, the big question is whether we're entering a "higher-for-longer" phase or if the FED plans to start cutting rates in 2024, and if so, how often. In this section, let's dig into what the past few months' data tells us and how it fits into the decisions around FED interest rates.
Despite these high interest rates, recent economic data reveals that the US economy is doing remarkably well. A crucial sign of economic health, consumer spending, has been rising, showing a 0.7% increase in September 2023 after a 0.4% bump in August 2023. Retail sales in October showed a slowdown, which was expected by the market but still a worrying sign.
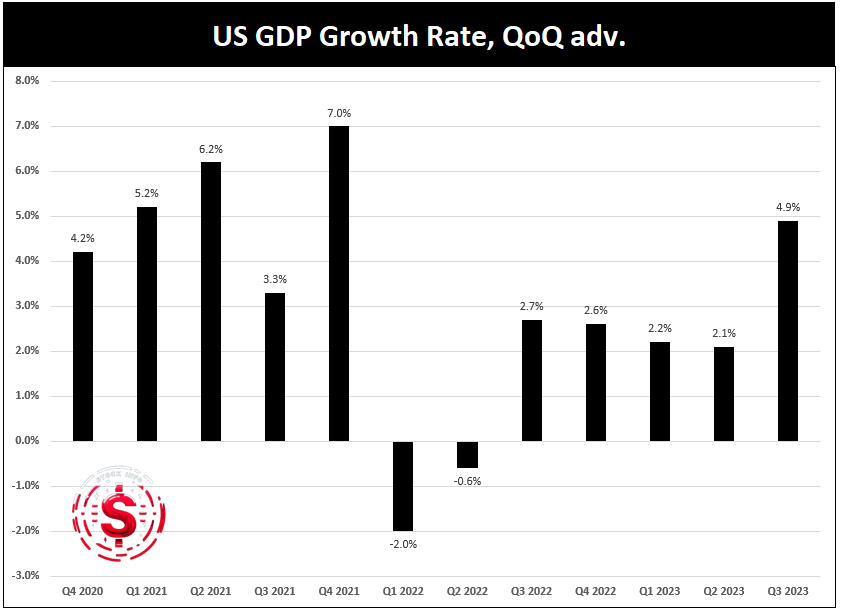
The Gross Domestic Product (GDP) is also on the upswing, especially in the third quarter of 2023, where the real GDP shot up at an annual rate of 4.9%. This significantly improved from the 2.1% increase in the second quarter.
Stock info with tradingecomics.com
Despite concerns about the rapid rise in interest rates potentially triggering a significant downturn in the US economy, a closer look at the chart above reveals that the only contractions occurred in Q2 and Q3 of 2022, marking the sole instances since Q2 2021.
The manufacturing sector has shown signs of stabilization, with the S&P Global US Manufacturing PMI holding steady at 50.0 in October 2023, a slight improvement from 49.8 in September. Notably, new orders increased for the first time in six months, indicating a revival in manufacturing demand. These positive developments underscore the resilience of the US economy in the face of the current high interest rate environment.
Additionally, the unemployment rate experienced a slight uptick to 3.9% in October 2023 from 3.8% the previous month. It's essential to note that this modest increase doesn't necessarily signal economic weakness; it could be attributed to more people entering the labor force.
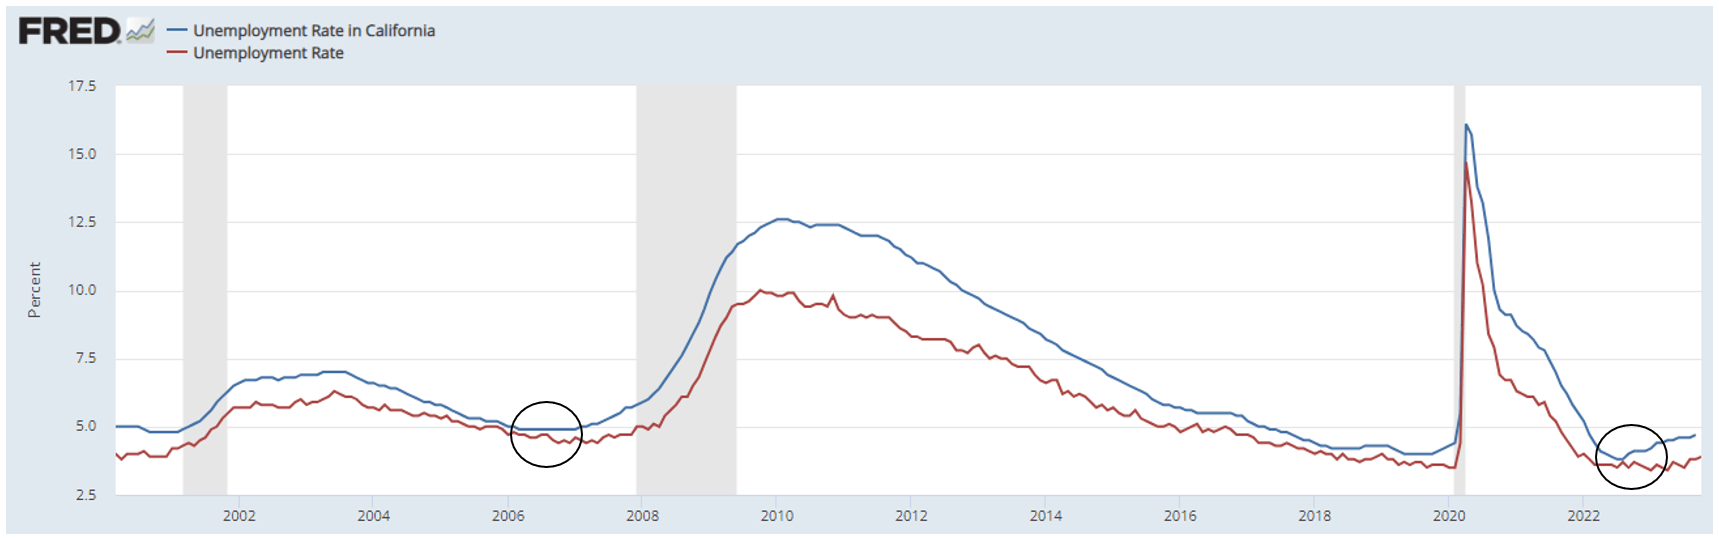
However, caution is needed as the uptick in unemployment might persist. Examining the unemployment rate specifically in California, a state that contributes significantly to the overall GDP, reveals signs of lingering unemployment concerns.
FRED
If we draw parallels to the last time the FED set interest rates as high as now, it would seem as though unemployment in the US as a whole lags that of California. If that is the case again, we may see overall unemployment rise.
Now for the big one: Last year, Powell pointed out that when it comes to inflation, we should pay more attention to core inflation due to the volatile nature of food and energy prices. Hence, the FED will not be preoccupied with the effect tensions in the Middle East have had on oil prices, for instance.
Why you may ask? The Federal Reserve prefers the PCE over the CPI for several reasons.
Firstly, the PCE has a broader scope, covering a more comprehensive range of goods and services.
Secondly, it better reflects how consumers change their purchases to account for rising prices.
The PCE allows for substitution effects, where consumers switch products due to relative price differences. This makes the PCE a more dynamic and accurate measure of inflation, as it can adapt to changes in consumer behavior. Therefore, the PCE is considered a more comprehensive and realistic measure of inflation, which is why the Federal Reserve prefers it.
The Fed's goal with these rate hikes is to cool down an economy that got too hot after the pandemic, causing some severe inflation. While they've stabilized prices, the battle isn't over. Gas prices, for example, have kept inflation at a 3.7 percent annual growth rate since August, according to the Bureau of Labor Statistics.
After the Federal Open Market Committee (FOMC) made its November rate decision, Fed Chair Jerome Powell left us with a key message – they're not entirely sure if the current interest rates are enough to tackle inflation.
Even though the Fed's primary borrowing rate is at a 22-year high of 5.25-5.5 percent, Powell seems hesitant to say it's the perfect spot. He has repeatedly reiterated that their long-term inflation target (sometimes referred to as “r-star”) remains 2%.
Here is the thing about the FED this cycle: Jerome Powell has clarified that their decisions will be based on what their models and macroeconomic data tell them is the best course of action. He has repeatedly mentioned that the labor market may be too tight and that robust economic data leaves the door open for further tightening.
Furthermore, a big part of that is wage growth. Despite the high prices we've been seeing, workers in the US are getting paid more. In September 2023, wages increased by 5.31% compared to last year's. And it's not a one-time thing – in August 2023, wages grew by 5.3%, outpacing the 3.7% inflation rate.
But here's the catch: back in 2022, when inflation was soaring, the real value of our paychecks took a bit of a hit. Even though wages spiked at 6.7% in the summer of 2022, it couldn't quite keep up with the even higher inflation rates. Therefore, the wage increase could be a case of wages catching up to the incredibly high inflation we saw in 2021 and 2022, which employers are now adjusting to.
Data suggests that while the American economy is still strong, consumer sentiment remains intact. This is also while inflation gradually decreases, which is good news for Powell and the rest of the FED.
With that being said, although strong, the economy is also slowing down, which is both a welcomed sight and a bit worrying.
It is welcomed, as the Fed may signal that they cannot raise interest rates more without causing a “hard landing,” which they want to avoid. It is also worrying because a slowing economy could mean we are on our way into a recession, which has been talked about for some time now.
It is too early to tell exactly where we are headed from a fundamental standpoint, and we need more data to confirm the direction.
We would be remiss if we did not mention the risk of a deflationary period. Deflation is problematic because it tends to reduce consumer spending as people anticipate lower prices in the future, potentially leading to decreased demand for goods and services. Additionally, deflation can increase the real debt burden, negatively impact investments and asset prices, contribute to unemployment, and challenge central banks in implementing effective monetary policies.
The overall consequence is a potential cycle of economic stagnation, as reduced spending, job losses, and decreased investment create a self-reinforcing negative feedback loop. Thankfully, the slowdown we have seen so far has been relatively marginal, and deflation is not an immediate concern at the moment. It is therefore very important for the Fed not to over-correct on inflation and throw us into the deflation loop.
Beyond figuring out if they've raised interest rates enough, the Fed faces another dilemma – how long should they keep rates this high?
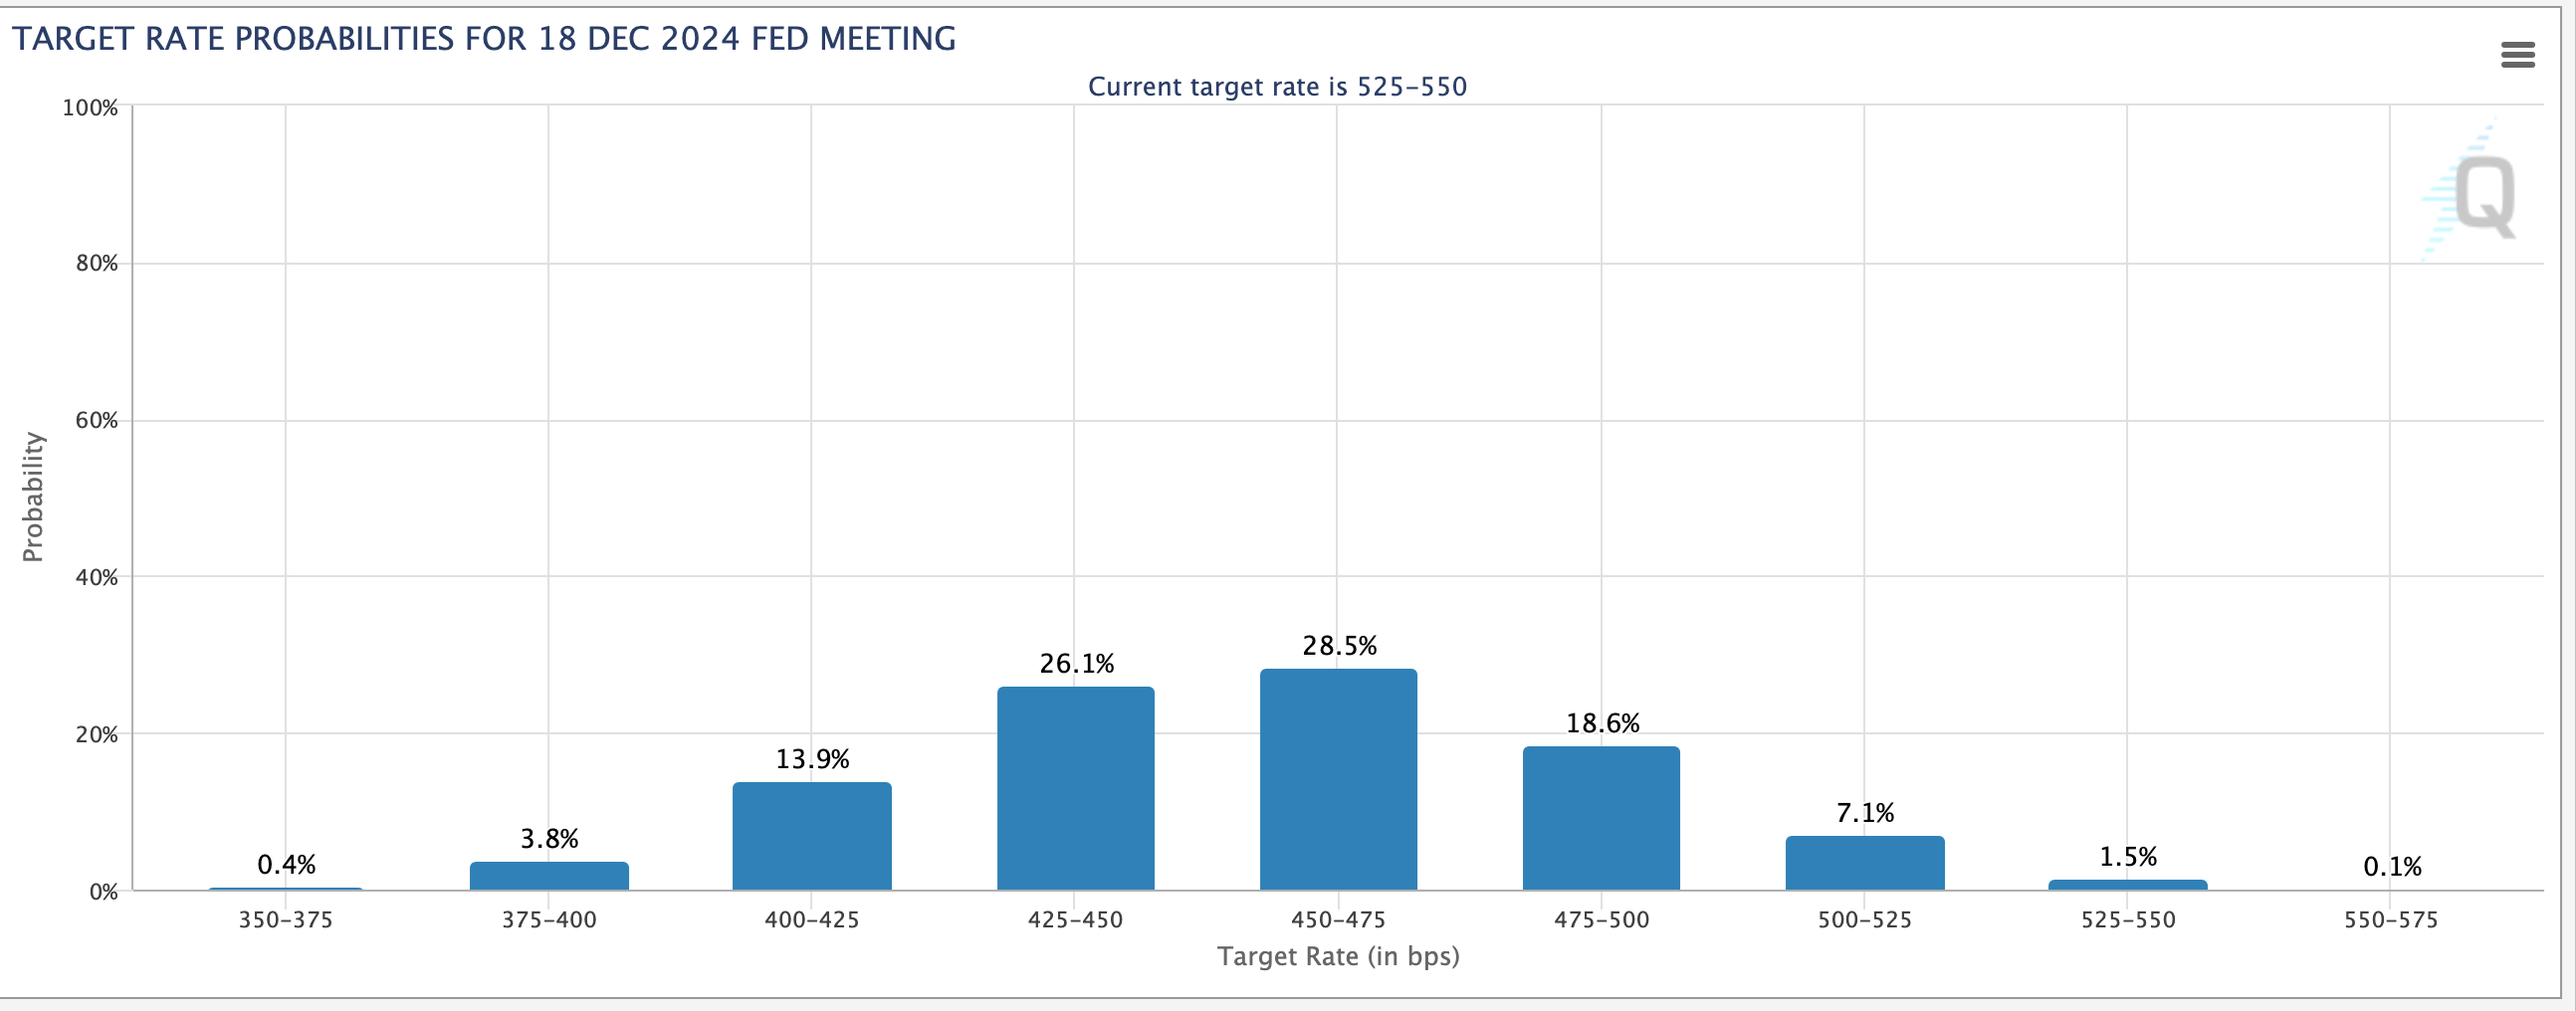
This is a considerable debate among policymakers and market participants. Still, we can get an idea about how the FED watch tool provided by the CME group tells us that the market is expecting the interest rate to be 75-100 bps lower than now by December next year.
CME Group
With inflation looking like it’s going to continue its downtrend in the coming months and the unemployment rate looking like it is heading upward, it is starting to seem as if the FED may have succeeded in achieving its goals. In addition, on November 14th, inflation once again came below expectations, essentially taking away some of Powell's arguments for further hikes.
Expectations for further rate hikes are currently slim to none, and it is a sensible idea to begin planning for investments in an environment with interest rates going down.
A Technical Inspection of The Market
In this section, we will look at the market from a technical perspective, which can help us gauge the breadth and potential direction of the market in the coming months. However, we want to clarify that the following figures merely indicate the overall direction the market could move.
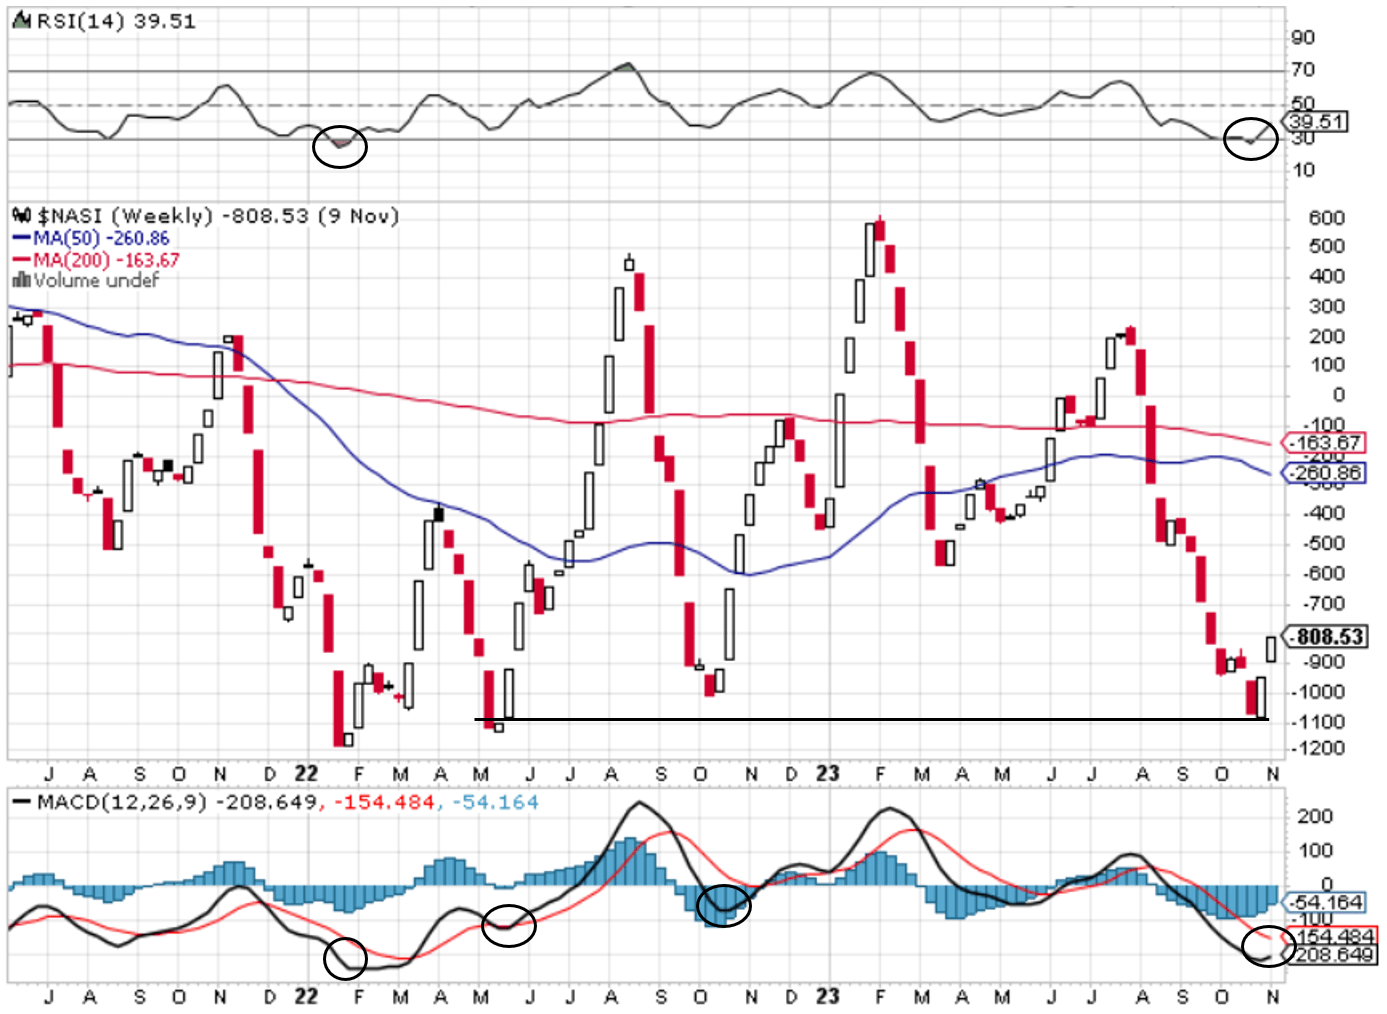
First, look at the $NASI, the Nasdaq McClellan Summation Index. The $NASI is derived from the McClellan Oscillator, a breadth indicator based on the difference between the number of advancing and declining stocks on a given exchange.
The Summation Index is a smoothed version of the McClellan Oscillator, providing a more long-term view of market breadth.
The two components in the index are calculated by doing the following:
- McClellan Oscillator: This is calculated by taking the difference between the 19-day exponential moving average (EMA) and the 39-day EMA of the net advances (number of advancing stocks minus declining stocks).
- The McClellan Summation Index is a cumulative measure of the McClellan Oscillator. It takes the daily values of the McClellan Oscillator and adds them to the previous day's value.
In general, the McClellan Summation Index, like other breadth indicators, is used to identify a market trend's underlying strength or weakness. High values suggest a strong and sustainable trend, while low values may indicate a lack of breadth in the market.
In the past two years, the $NASI, combined with the RSI and MACD indicators, have shown some relatively strong bottoms in the market.
The main takeaways we want to give you from the graph below are the following:
First, the NASI is recovering from the lowest levels since October 2022, bottoming at around -1.100 on the index. The Nasdaq rallied from just over 10.000 points to approximately 11.500 in 6 weeks. Second, the MACD is changing direction from a solid downtrend to an uptrend. Combined with the RSI bouncing off the 30 level, this provides further evidence of a potential bounce to the upside. Lastly, the setup looks too similar to other bottoms we have seen in the last two years, and it is difficult not to reject the notion that we have perhaps found a new bottom in late October this year.
The NASI tells us that the market has been stretched too much to the downside and that the index should start moving up again. We have to wait and see the question about how much the upside is.
Stockcharts.com
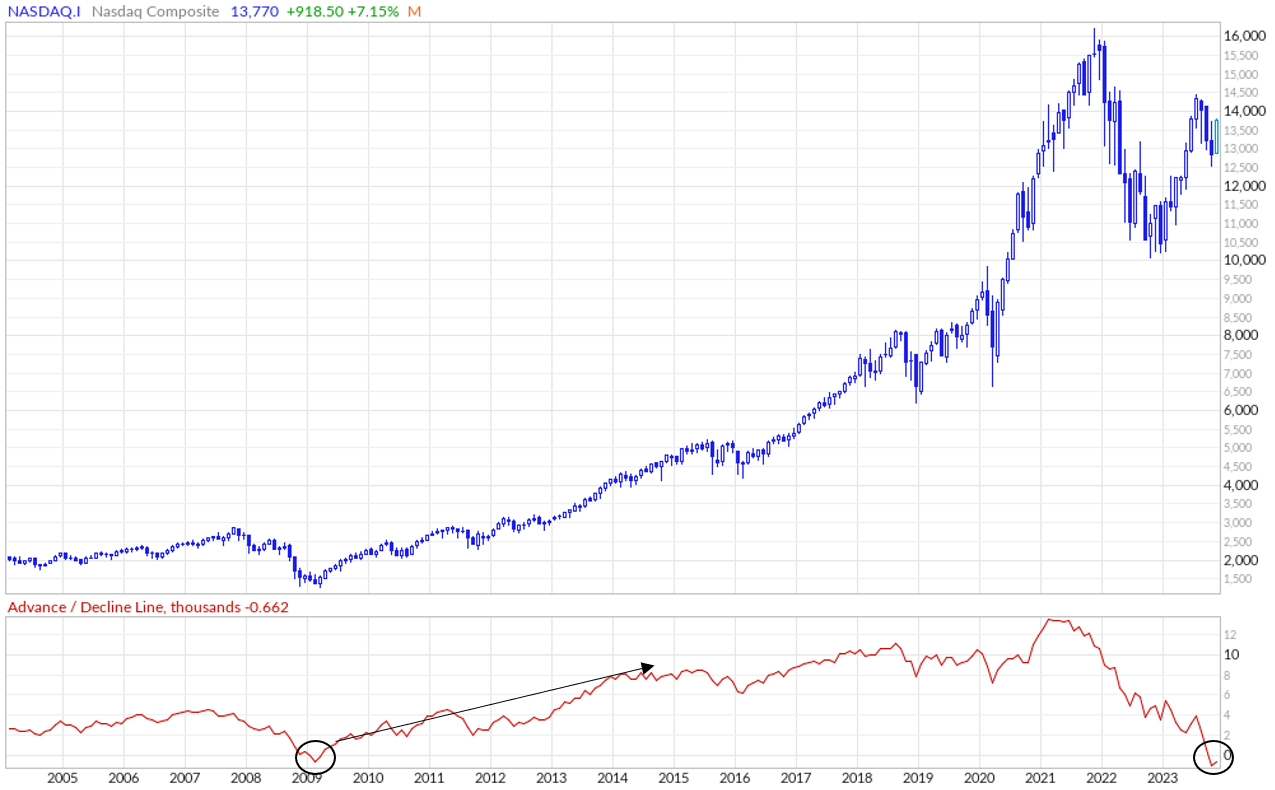
Next, we want to zoom out and look at market breadth on a much bigger scale. We look at the Advance/decline line (AD line) on the Nasdaq for this.
The AD Line is a helpful indicator for evaluating market breadth. It's calculated by subtracting the number of declining stocks from the number of advancing stocks and adding that to the previous value. When more stocks advance than decline, the AD Line goes up; when the opposite happens, it goes down.
To make sense of it, compare the AD Line's movements with the actual performance of the index it represents. The AD Line should essentially confirm whether the index is rising or facing a decline by moving in sync with those trends. We have not been seeing that for most of 2023, as the AD line has been declining, while the Nasdaq was rising in the middle of this year. What this tells us is that the heavy stocks in the Nasdaq have been carrying the index for most of the year, with many of the smaller companies declining.
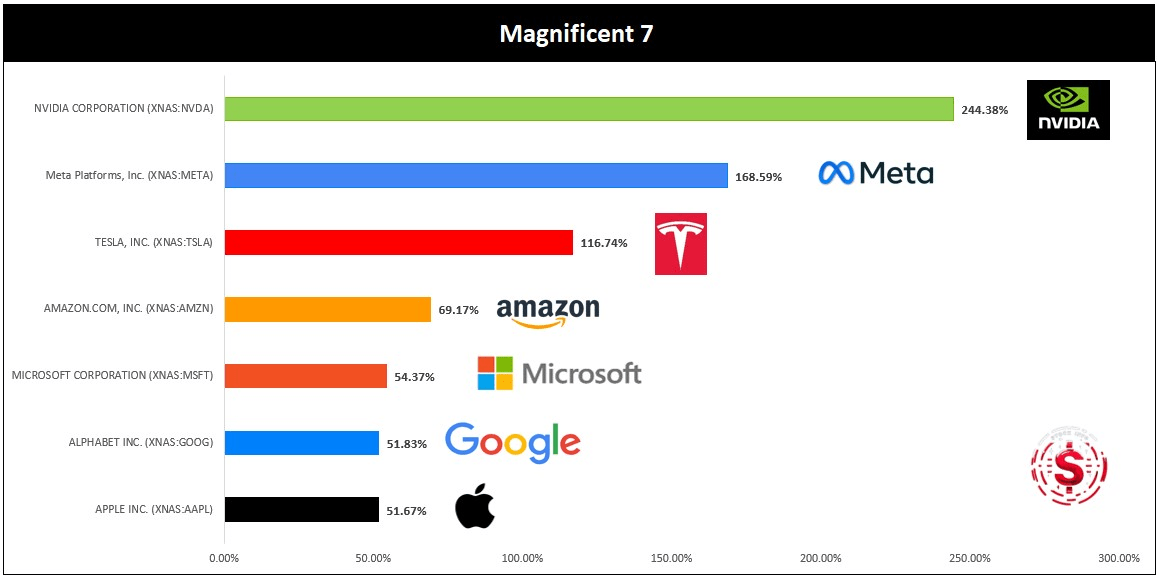
As can be seen in the graph below, Nvidia (NVDA), Meta (META), and Tesla (TSLA) have truly been carrying the index this year, and with a shocking 244% return for Nvidia YTD, it's no wonder we do not see the index struggle as much as many other companies in the Nasdaq index.
Even Apple (AAPL), Alphabet (GOOGL), Microsoft (MSFT), and Amazon (AMZN) had returns of over 50% year-to-date. It is pretty clear that the so-called "Magnificent 7" carried the index.
Stock Info
What is interesting about the AD line is that we are currently at the lowest levels since the great financial crisis. What happened afterward? A compelling, multi-year advance in the Nasdaq that continuously found new highs. Will it happen again this time around? It is way too early to say.
However, the evidence in the data tells us that there is not much more downside in the near term, at the very least.
marketinout.com
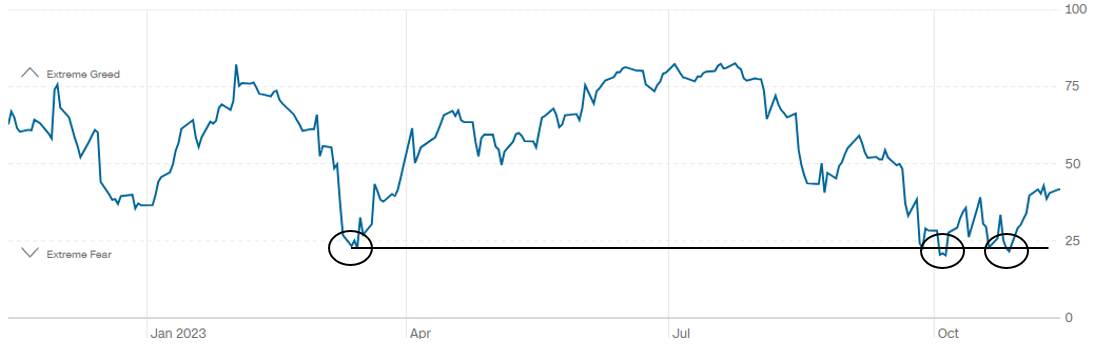
Now that we have looked at the market breadth at both medium and long-term timeframes, we want to move on market sentiment. For this, we want to draw your attention to the Fear and Greed Index by CNN. It is an excellent tool to gauge market sentiment.
However, how it is calculated is unknown to the public, as CNN considers it a proprietary formula. Nonetheless, we know the index is based on a combination of various factors and indicators that reflect market sentiment.
Normally, sentiment indicators like the Fear and Greed Index consider factors such as:
- Volatility: High volatility can be associated with fear, while low volatility might indicate complacency or greed.
- Market Momentum: Positive momentum in the market might be associated with greed, while negative momentum may be linked to fear.
- Put and Call Options: The ratio of put options to call options can indicate market sentiment. A high ratio may suggest fear, while a low ratio may suggest greed.
- Market Breadth: The number of stocks advancing versus declining can provide insights into market sentiment.
- Safe Haven Demand: The demand for safe-haven assets like government bonds or gold during uncertain times may contribute to the index.
If we look at historical measurements of the Fear and Greed Index, we see that we measured below 25 twice in October and at the same level as back in March of this year. This underscores our thesis about a possible bottoming out on the market.
CNN.com
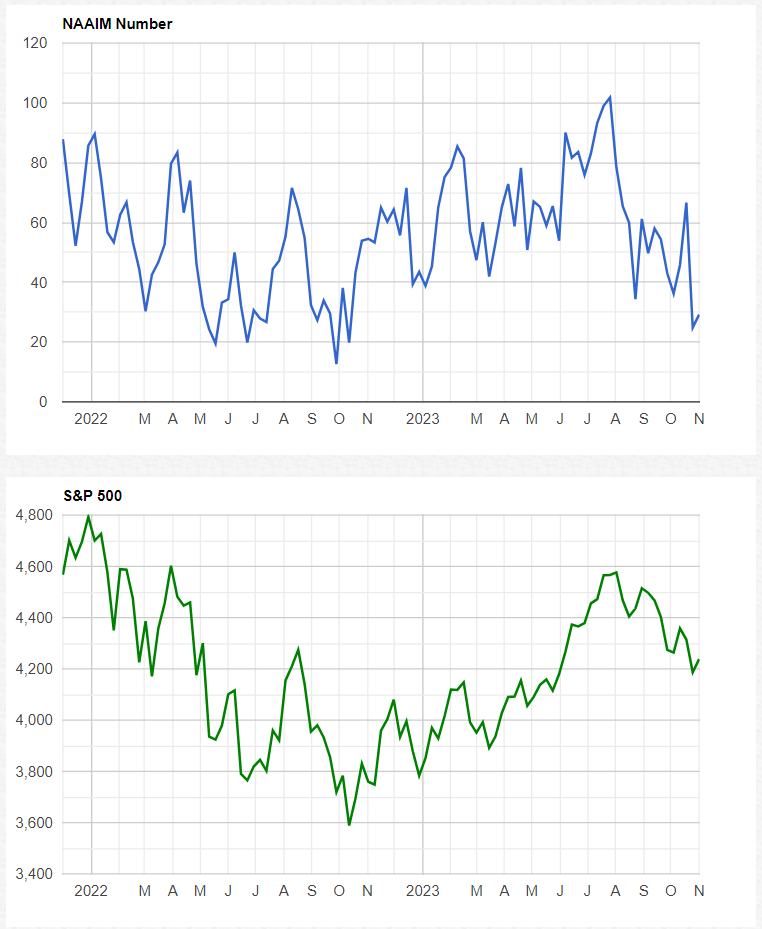
The last graph we want to show is the National Association of Active Investment Managers (NAAIM) index, which shows the average exposure of US equities reported by association members. It is a valuable tool to stay updated and in tune with how active investment managers adjust twice weekly.
Essentially, and much like the Fear and Greed Index, it has been a relatively good indicator to determine local highs and bottoms in the past almost two years.
Most importantly, the Index reached 100 when the S&P 500 topped in late July, and as of the end of October this year, it was close to 20, which was a good entry point into the market back in October 2022.
NAAIM.com
To summarize everything we have just been through, we want to highlight the similarities between current market conditions and previous bottoms in the market. This is not to say that this data is the end of where the market will go. However, investors should pay close attention to market breadth and sentiment, as these can be powerful indicators for when to go risk on and when to go risk off.
While we have focused a lot on the Nasdaq, it is essential to remember that the US markets tend to move in relative unison. Therefore, many of the conclusions from the charts above can also be applied to the S&P500.
Conclusion
Our analysis suggests that the recent market correction provides a promising opportunity for a long-term upward trend. Various technical indicators, market breadth, and economic data reveal a resilient US economy despite challenges such as high-interest rates.
While recent consumer spending and unemployment data suggest the economy is starting to slow down, we are still not in danger of a deep recession, but it is important to keep an eye on it.
While there are positive signs like rising consumer spending and a growing GDP, concerns about a potential economic slowdown linger. The Federal Reserve's role in managing inflation and interest rates remains crucial, with uncertainties about their future decisions.
The focus on wage growth and other economic indicators indicates a delicate balance in achieving economic stability. Although there are potential signs of a market bottom based on historical patterns and sentiment indicators, caution is advised, especially in the short term.
While deflation is not an immediate concern, the Fed must avoid over-correction on inflation to prevent entering a deflationary cycle. Investors are encouraged to closely monitor market breadth and sentiment for informed risk management in these dynamic conditions.
Keep in mind that this article’s main purpose is to inform you about the current market outlook and show you indicators that are worth watching to determine whether a potential uptrend or downtrend is coming. We plan on doing these articles once every quarter to keep a pulse on the overall market.
Comments