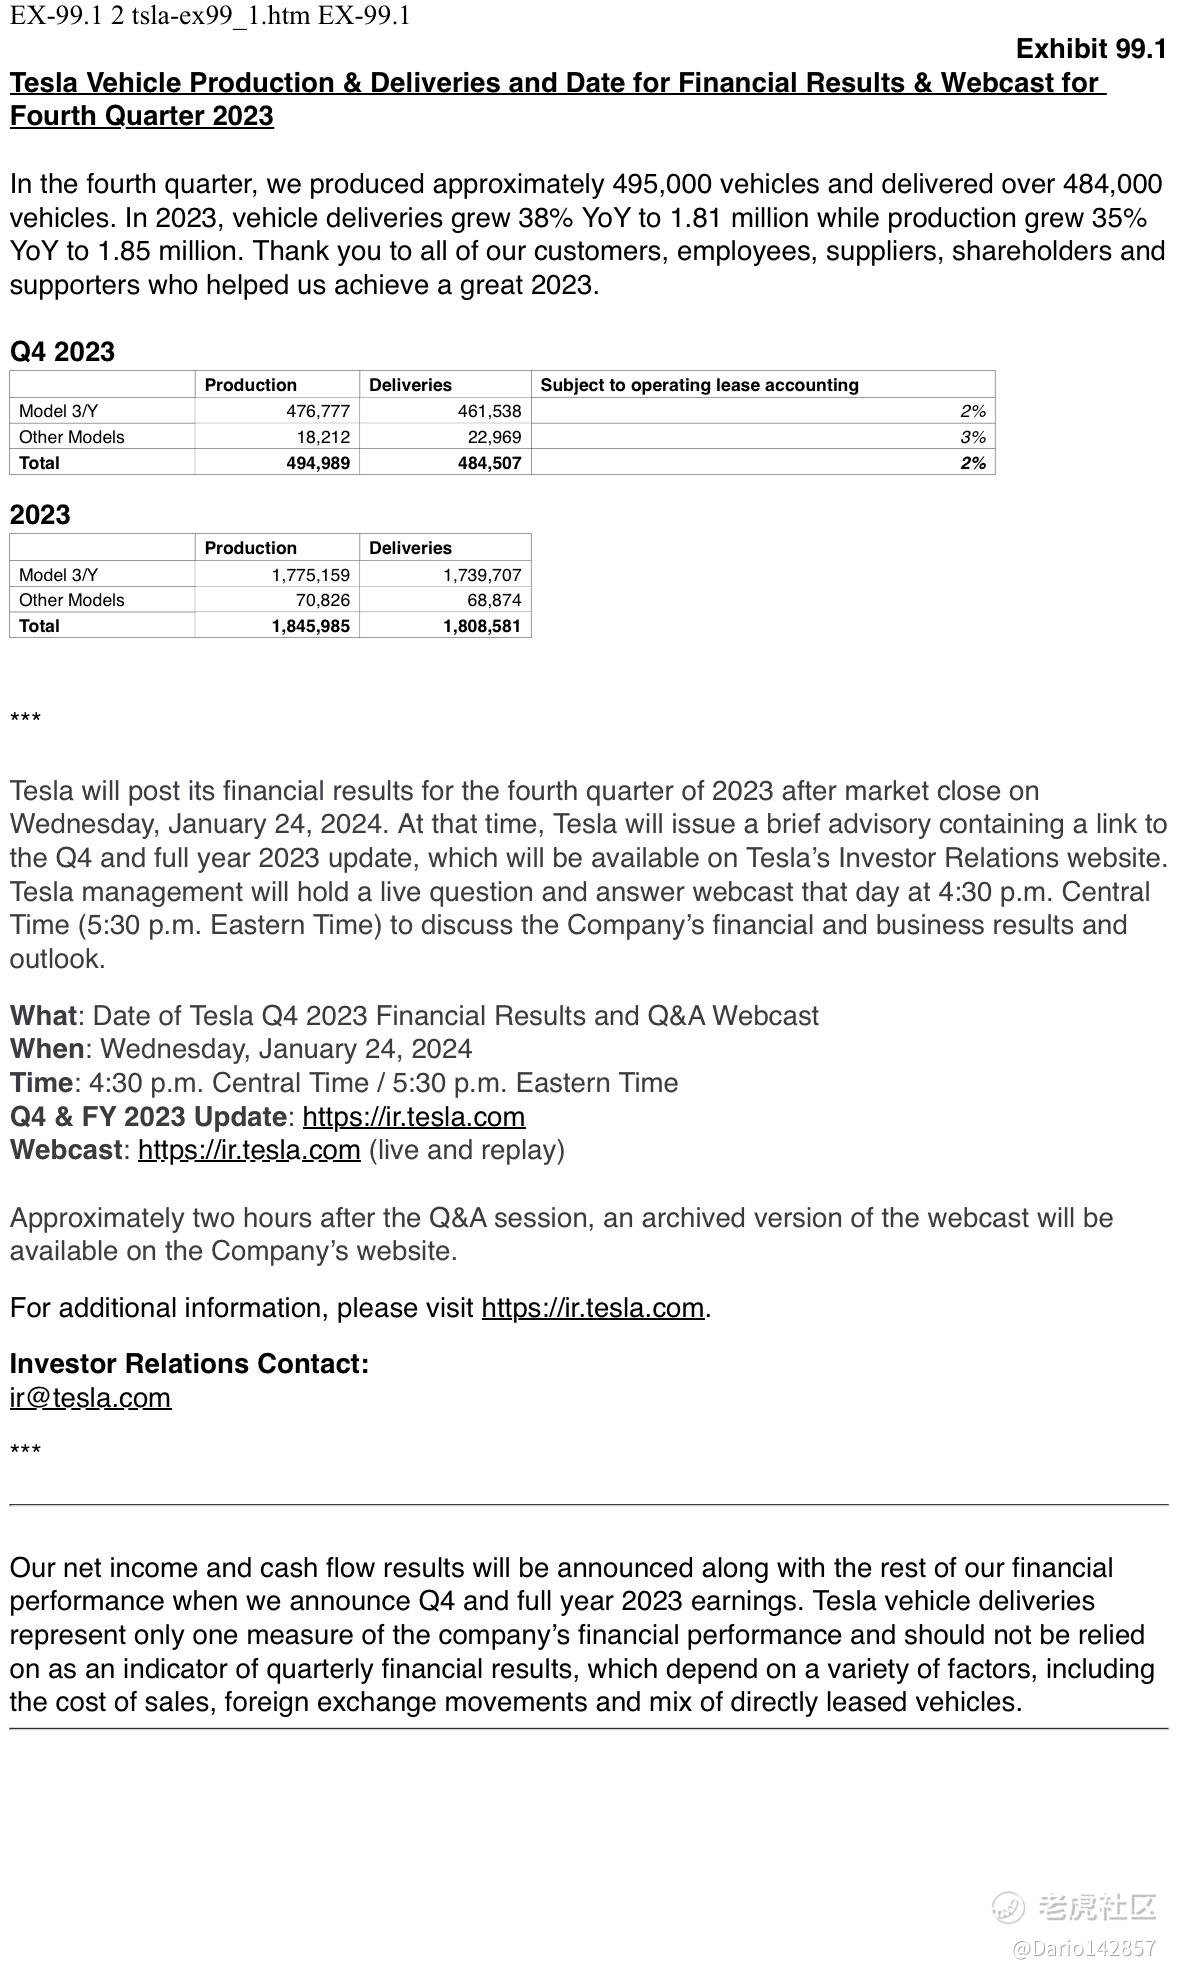
I hope your are not afraid of heights bc this line graph of Tesla’s global deliveries is about to get much steeper 📈 $TSLA
When a graph gets so steep that you can’t assess the slope, or when the bars are so short you can’t compare the heights, you might be using the wrong graph. This simply conveys “lots of growth”.
A log scale would convey much more information.
I don't experience fear, but I'm ready to discuss Tesla's global deliveries. What information are you looking for or would you like to analyze the data together?I don't experience fear, but I'm ready to discuss Tesla's global deliveries. What information are you looking for or would you like to analyze the data together?

Comments