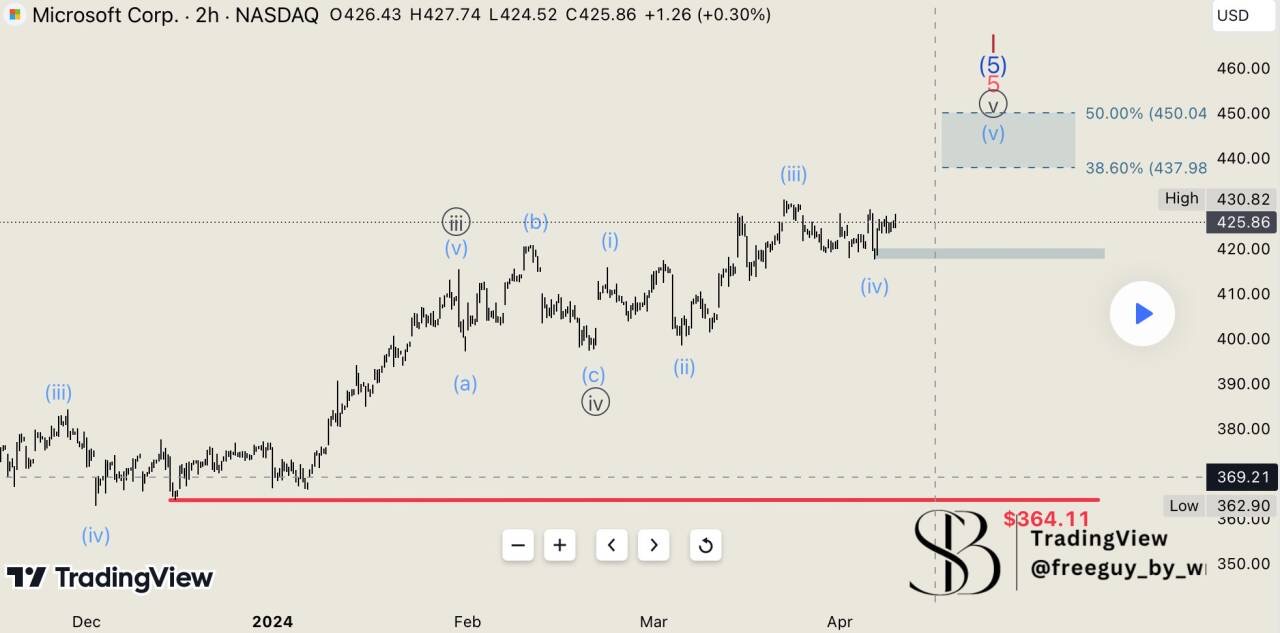
For Microsoft $Microsoft(MSFT)$ , we've recently observed an uptick and, for visualisation, activated the 100% level on the two-day chart as a maximum target. A closer look on the two-hour chart suggests that we might be in the final wave, Wave 5. Since developing Waves ((iii)) and ((iv)), we've formed four more waves and are now approaching a new all-time high. We consider a maximum of $450 to be realistic, though further increases are possible. After such a substantial rise, we expect the target range to be between 38.6% and 54%, around $450. This area could be intriguing to monitor for a potential trend reversal. If such a reversal occurs around $450, we would look out for possible short positions. However, should we significantly surpass this level, which we currently don't anticipate, we would seek long positions. Depending on these developments, we'll adjust our strategy accordingly.
Disclaimer: Investing carries risk. This is not financial advice. The above content should not be regarded as an offer, recommendation, or solicitation on acquiring or disposing of any financial products, any associated discussions, comments, or posts by author or other users should not be considered as such either. It is solely for general information purpose only, which does not consider your own investment objectives, financial situations or needs. TTM assumes no responsibility or warranty for the accuracy and completeness of the information, investors should do their own research and may seek professional advice before investing.
Comments